Statistics
The Statistics tab shows you a wide range of information about the performance of your sites and ad zones. The Graph Data panel at the top of the screen shows you charts of data related to your campaigns, while the Table Data panel at the bottom shows you tables of important data for recent dates.
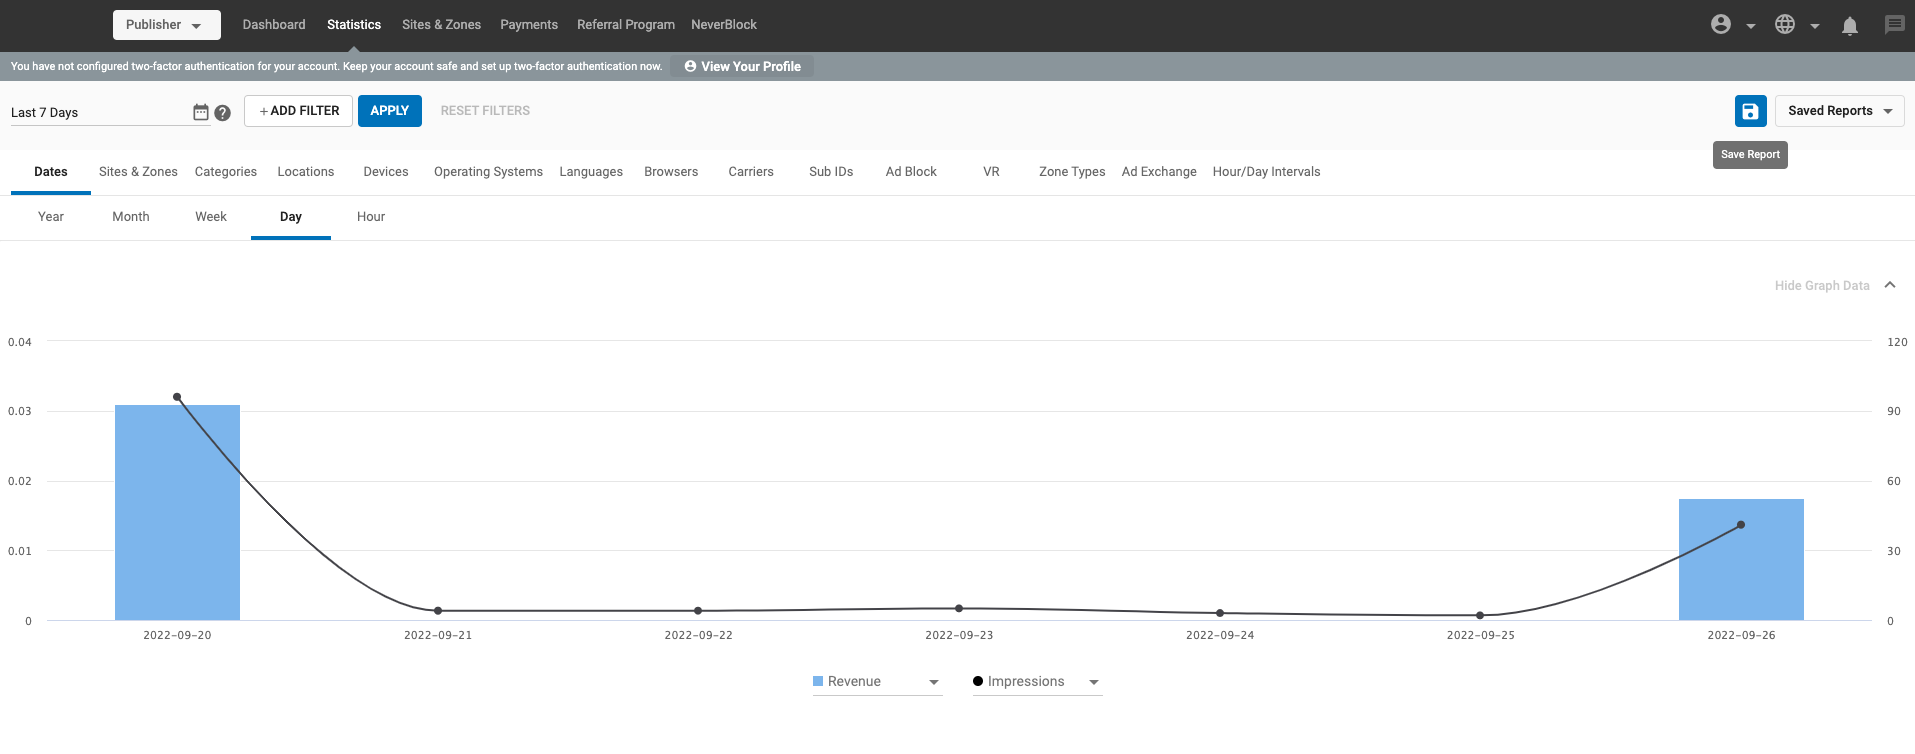
The information in the Statistics tab is broken down across several groups and dimensions. Data is displayed in New York time zone (EST or EDT). The only exception is the Hour dimension within Dates. In this breakdown, you can change the statistics time zone by selecting the corresponding country in the bottom right of the graph on this tab, choosing the corresponding time zone (if there are multiple), then clicking Apply: Data is displayed in New York time zone (EST or EDT). The only tab where you use a different time zone is the Hour sub-tab within Dates. In this breakdown, you can change the statistics time zone by selecting the corresponding country in the bottom right of the graph on this tab, choosing the corresponding time zone (if there are multiple), then clicking "Apply":
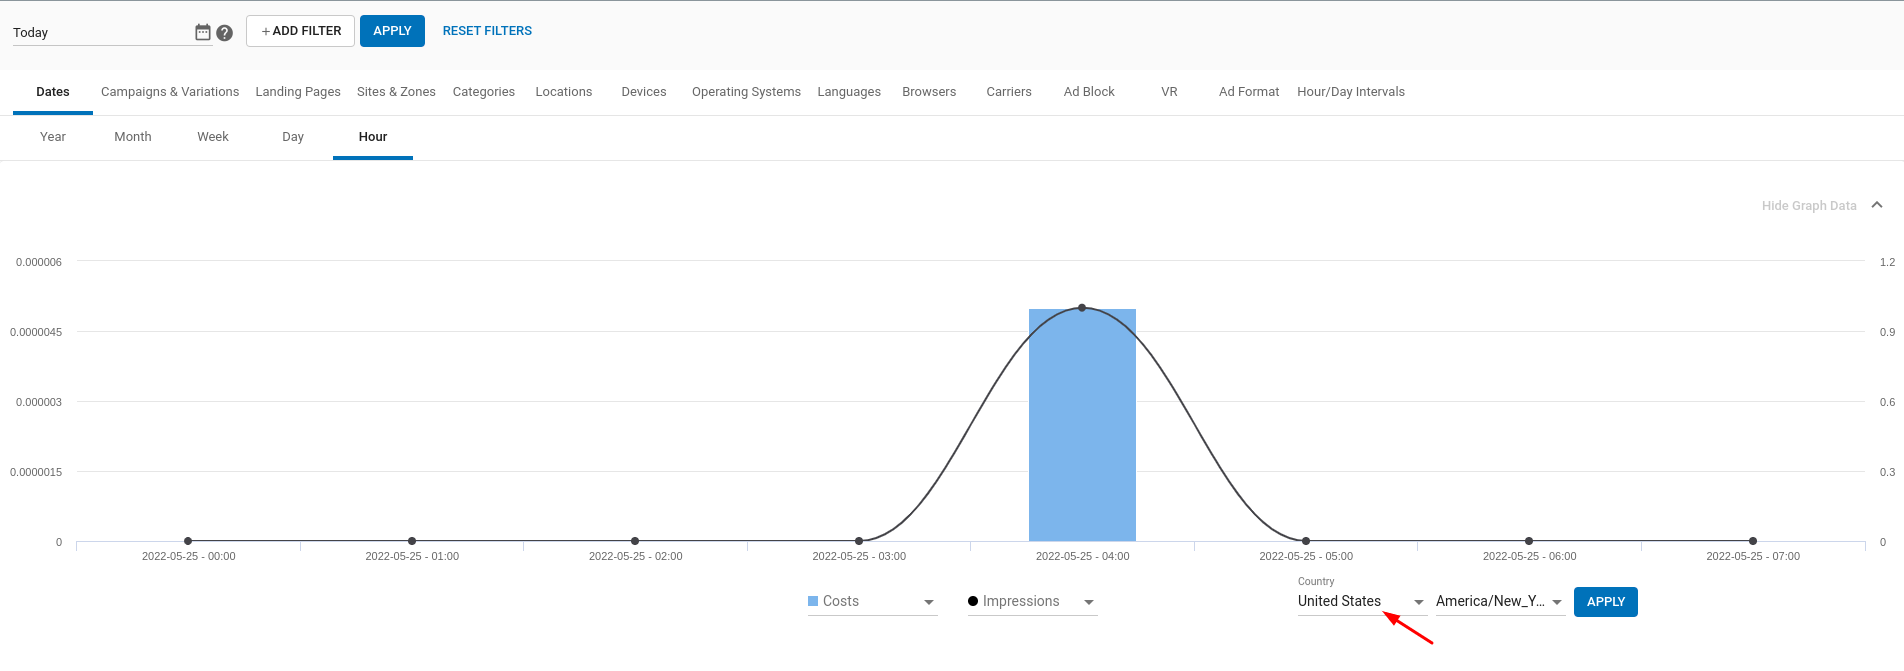
Note: Hourly data is available up to the last 30 days of data.
Dimensions Available
Below is the list of all dimensions available to publishers:
| Group | Dimension Name | Values |
|---|---|---|
| Dates | Year,Month,Week,Day,Hour | Contains values broken down by different time measures. |
| Sites & Zones | Domains | Contains values for the publisher domains. |
| Site Types | Contains values for Site Types. | |
| Sites | Contains values for Site names. | |
| Ad Zones | Contains values for Zone names and Zone IDs. | |
| Multi-Format zone Details | Contains values for zones included within Multi-format settings. | |
| Categories | Categories | Contains the Categories from the pages where the ad was shown. |
| Locations | Countries | Contains values for countries as per IP address. |
| Regions | Contains values for regions as per IP address. | |
| Devices | Device Type | Contains values for device types such as Desktop, Mobile, Smart TV, Console, etc. |
| Devices | Contains values for devices in the format of device type and manufacturer name, such as Mobile-Iphone, Mobile-Samsung, Tablet-iPad, etc. | |
| Operating Systems | Contains values for the operating systems used on the devices where ads were requested. | |
| Languages | Contains values for the end users' languages. | |
| Browsers | Contains values for the end users' browsers. | |
| Carriers | Contains values for the end users' mobile carriers. | |
| Sub IDs | Contains values for SubIDs numbers. | |
| Ad Block | End users with or without AdBlock software enabled | |
| VR Users | End users who are requesting ads via VR. | |
| Zone Types | Contains values for the Zone Types where the ad was shown. | |
| Hour/Day Intervals | Day of Week | Contains values for the days of the week. |
| Hour of Day | Contains values for the hours of the day. | |
| Traffic Type | Contains values for the categorization of the traffic based on the quality of the traffic: RON, Premium, Members Area, etc. | |
| Age Verification Status | Contains values indicating whether the user has verified their age or not |
Adding filters and determining the Time Period of the data

You can add filters to your data for a more granular insight of your results. To filter the currently selected tab based on your desired segment, click on the +ADD FILTER button and select the item/s you wish to filter by.
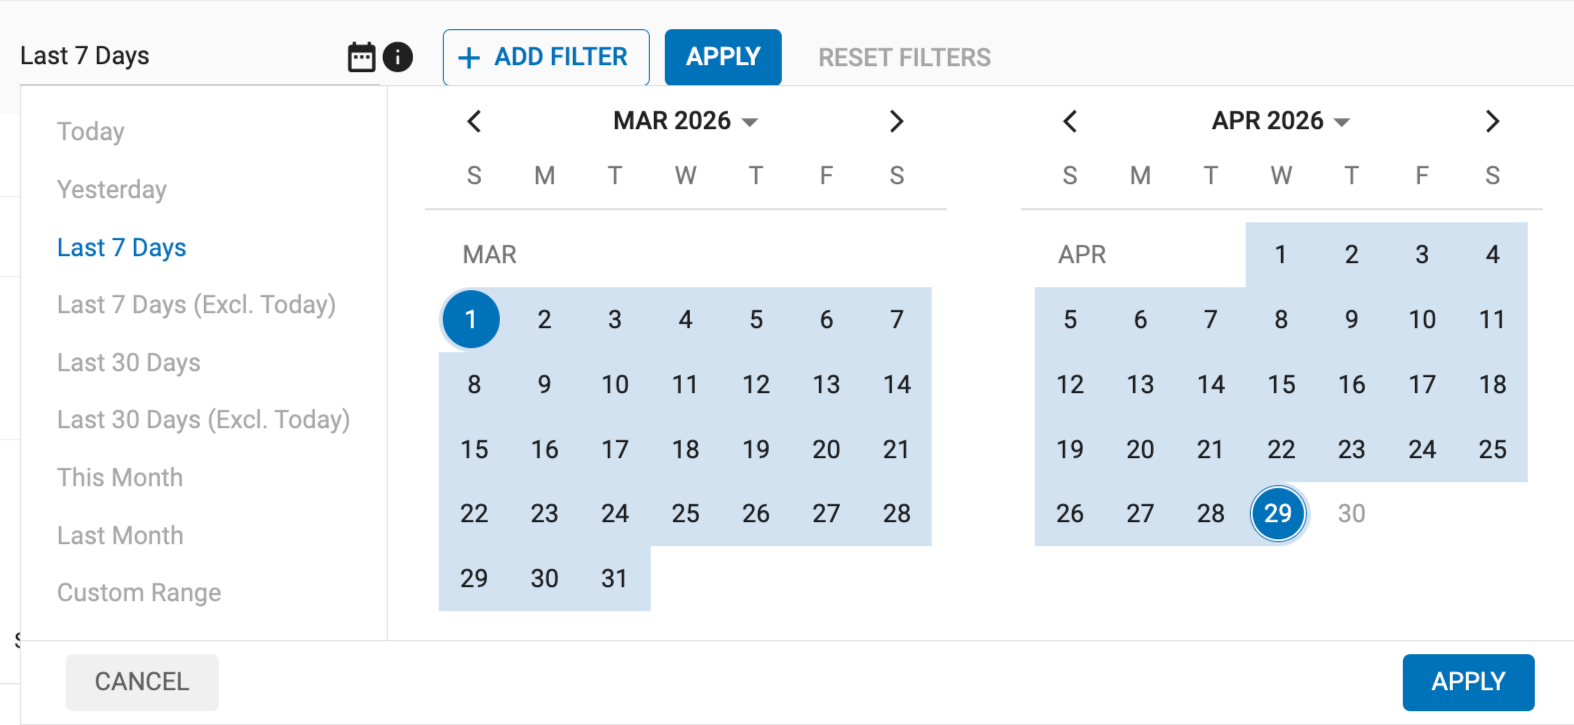
You can also change the Time Period of your data. The statistics show the Last 7 Days by default, but you can choose a different period by clicking on the calendar icon to the left of the +ADD FILTER button. You can choose a date as far back as the last two years.
You can also drill-down into your data in the Table Data panel. If you click on a specific data row, that segment will be added as a filter to the existing selection of filters and will remain for all other Statistics tabs you navigate to.
Filters and Time Period can be reverted back to default by pressing the Reset Filters button.
Filter settings
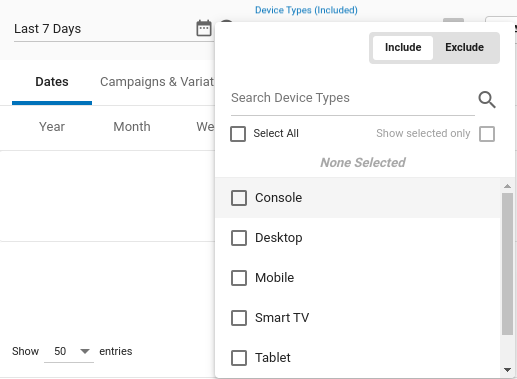
When adding a filter, you can either Include or Exclude that filter.
When you choose to Incude a filter, you will limit the data to show only the segments that match the filter conditions. For instance, if you choose to Include Chrome Browser and Android OS, then you will only see the traffic that belongs to that specfic browser and OS.
If you choose to Exclude a filter, you will remove any data that matches any of the conditions you specify. For instance, if you choose to Exclude Chrome Browser and Android OS, then you won't see any traffic coming from that Browser or from that OS.
You can search for specific items within the chosen filter using the search bar. You can also select all available items within the filter by clicking the Select All checkbox. Lastly, you can review all your selected options by clicking the Show Selected Ony checkbox.
Saving Custom Filter Set
Using the Save Report option, you can save filter sets on the statistics page, give this filter set a custom name, and choose from a list of previously saved filter sets.
Saving a report
As a user, the default view of the statistics tab will not have any filters applied. You can either save a filter report by adding a few filters of your choice or choose from the list of already saved filters to obtain the desired view.
Note:
- The Statistics page will be reset once you leave to go to another page in Admin Panel.
- You can see the list of saved filters in the Saved Reports dropdown.
- The order of sorting the Saved reports will be the latest one created on top.
Update the existing report or Save As a new report
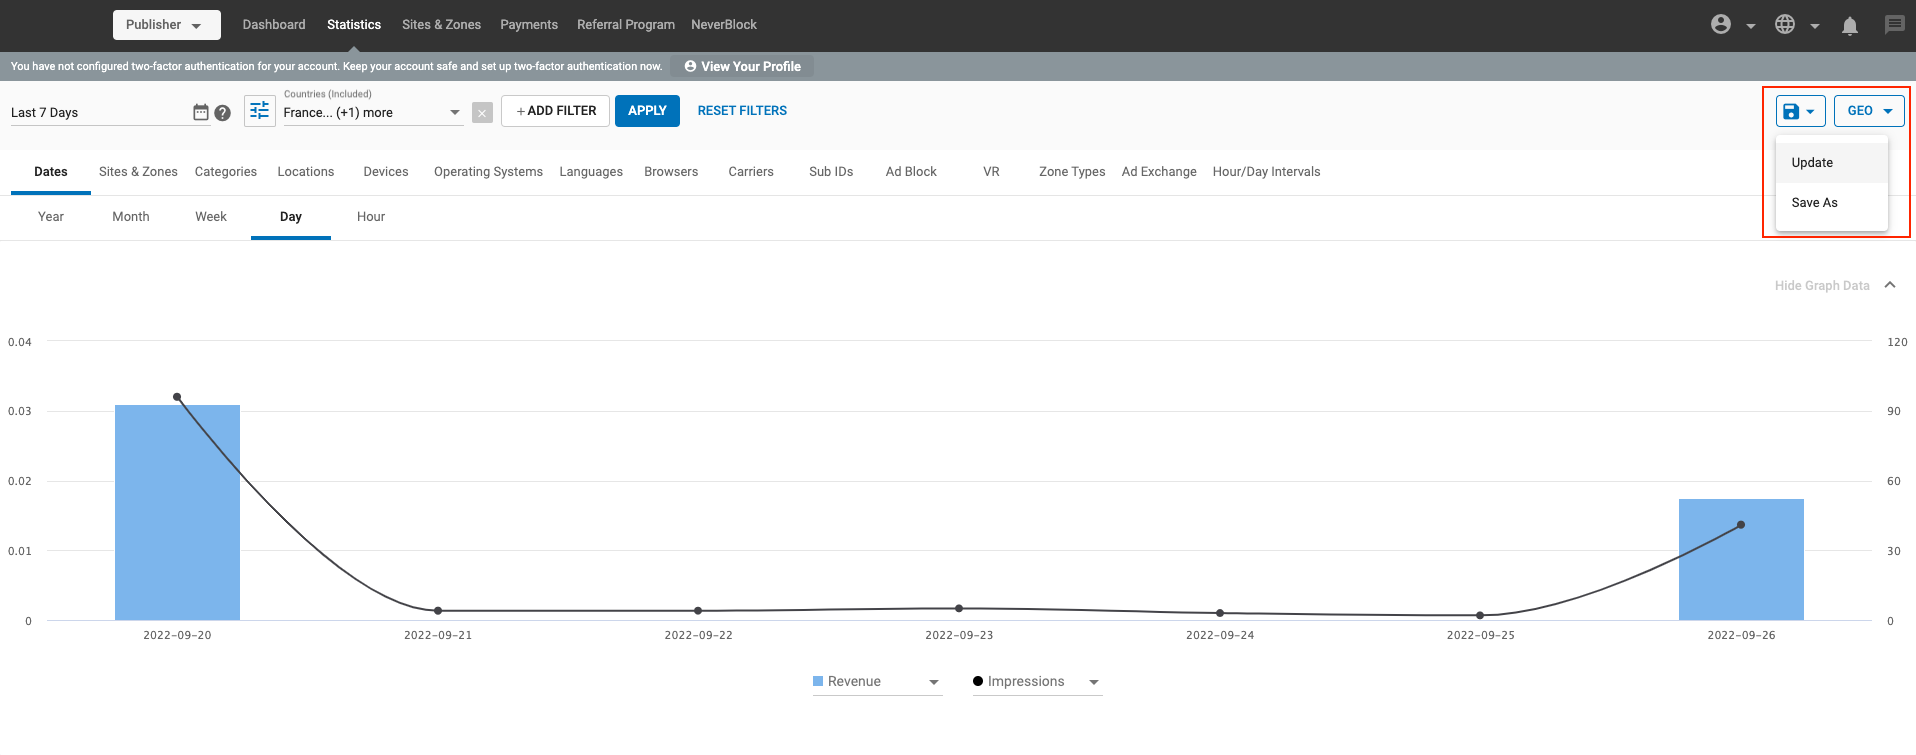
Update
- You can update an existing saved report by selecting it, changing the filters and then clicking on the Update button.
- The filter setting will be updated and saved under the chosen Saved Report.
Save As
- You can also save an existing filter set with another name by clicking on the Save As option.
- Or you can also Save As a new report by adding or removing a few filters from this set.
Rename, Delete a Saved Reports
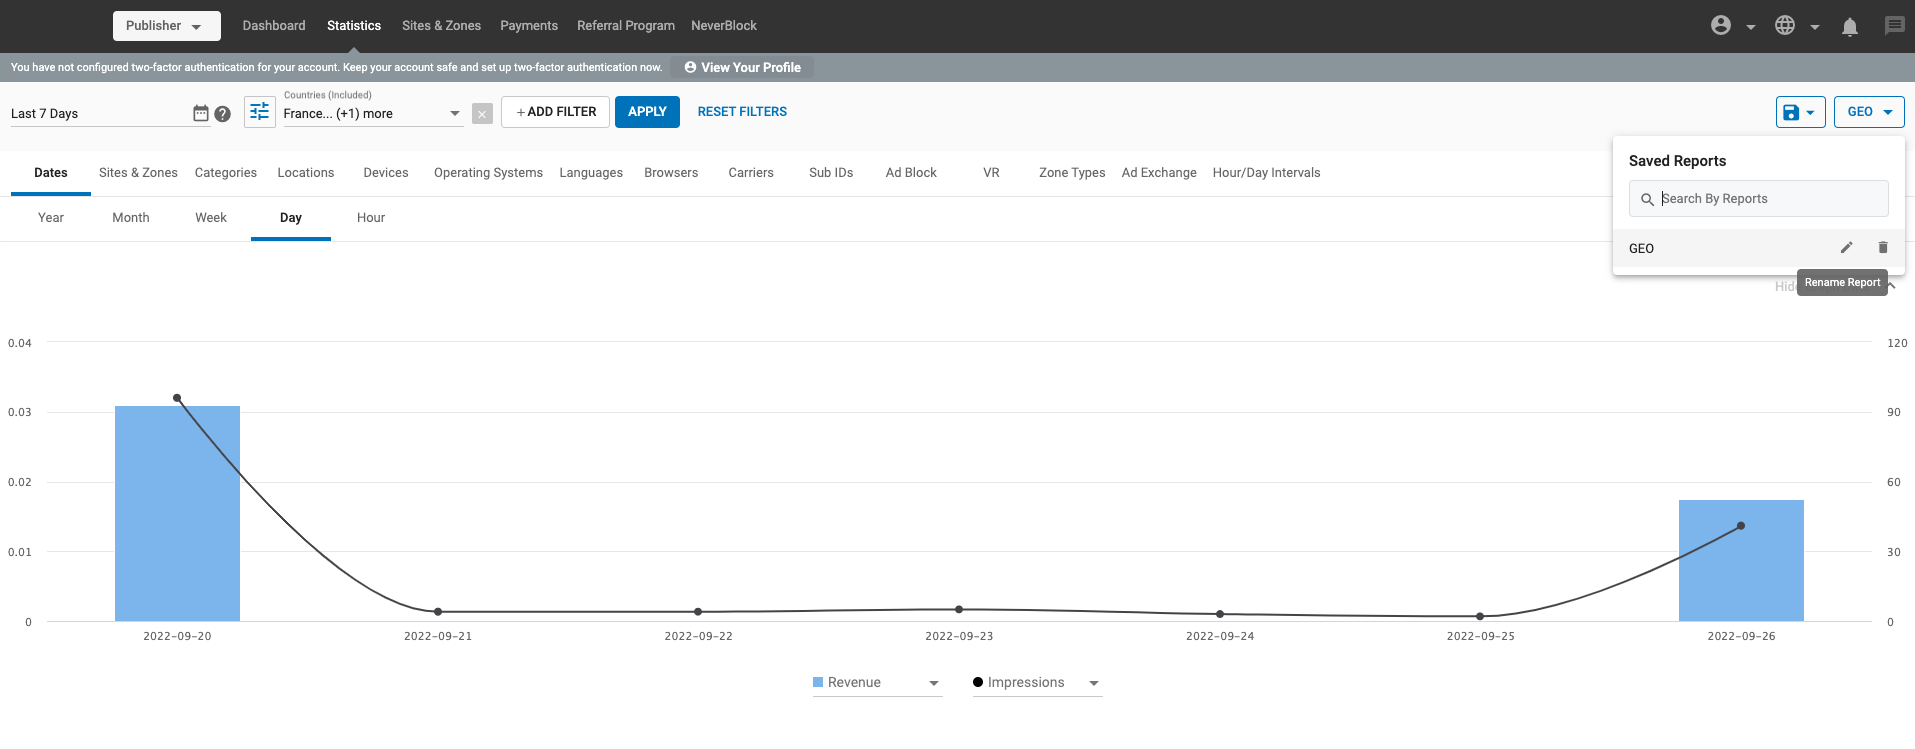
Using the action buttons against each saved report in the Saved Report drop-down, you can either edit or delete a report.
- The Pencil Icon helps rename a Saved Report. Note that no two reports can have the same name.
- The Bin icon helps delete a Saved Report. Note once a report it deleted, you cannot undo this action.
The Graph Data Panel
For any of the tabs in the Statistics tab, you can choose what information you would like to see in the graphs in the top half of the screen:
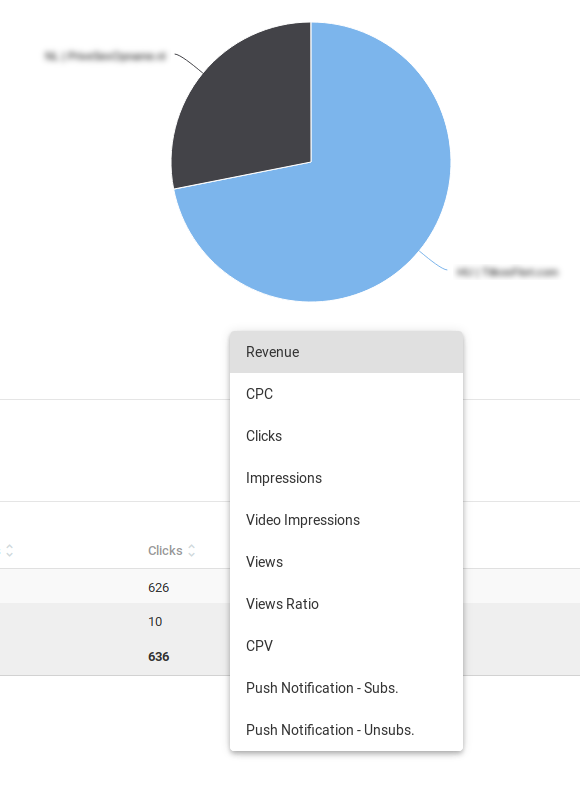
All the groups in the Statistics tab allow you to view charts for any of the available metrics. The type of chart will vary depending on the group or dimension you have selected:
- In the Dates tab and in the Hour/Day Intervals tab, you can choose two metrics presented in two concurrent line and bar graphs.
- Locations will show you a world map where you can see your data broken down by country. You can zoom in and out of the map using the + and - buttons on the left.
- All other groups will show a single pie chart.
The Table Data Panel
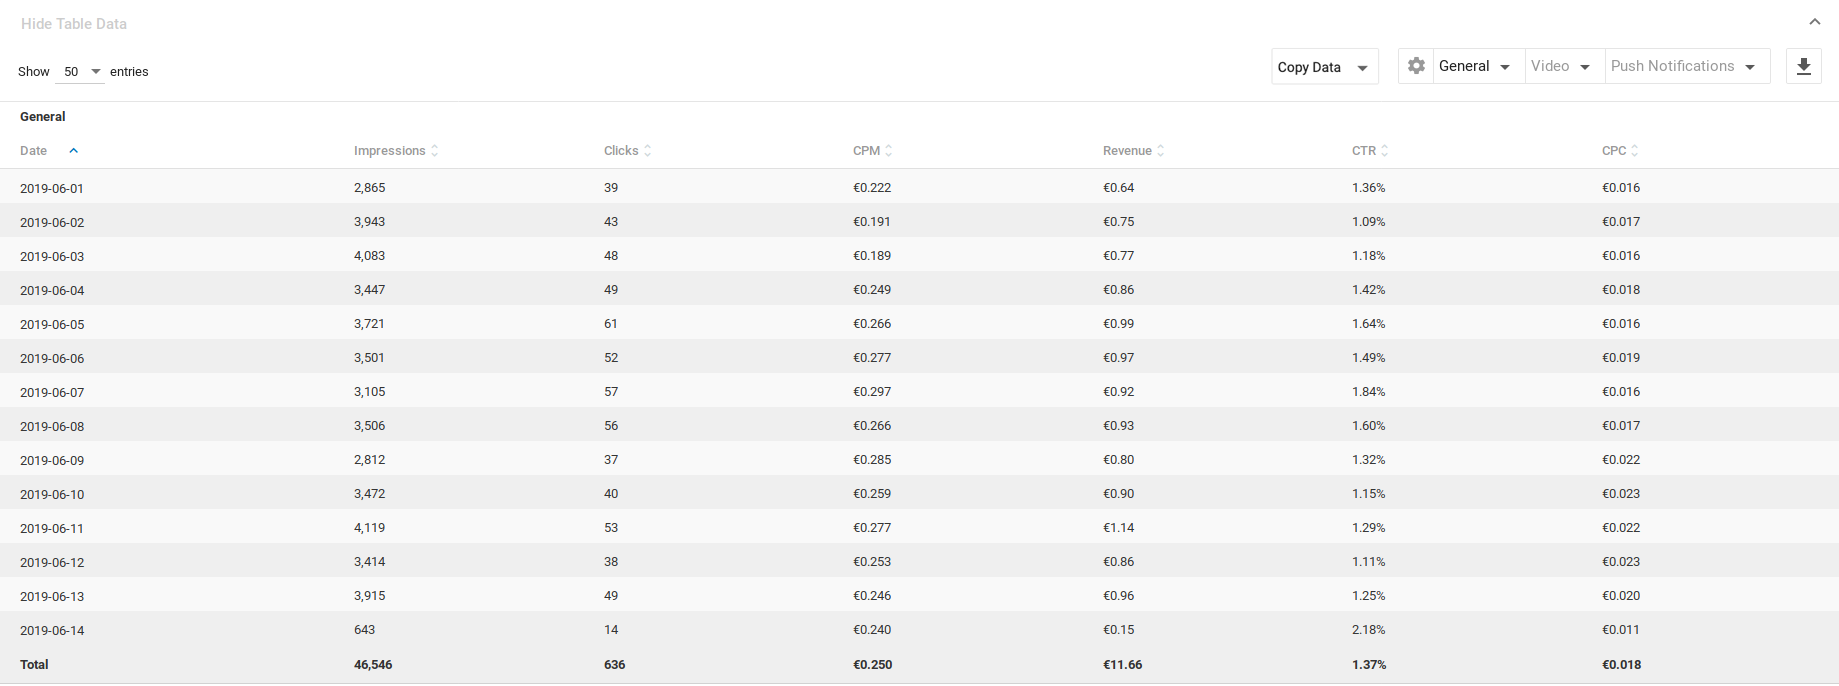
The Table Data panel shows the data in the Graph Data Panel in tabular format. In the Show X entries drop-down in the top right of the Table Data panel, you can choose how many lines of data you wish to see in the table. You can also click the arrows beside any of the column headers and sort the data from lowest to highest value.
By default, the Table Data panel only contains the General Panel. However, you can add the Video, Push Notifications and RTB panels to the right of the General panel through the Toggle Options.
The General Panel
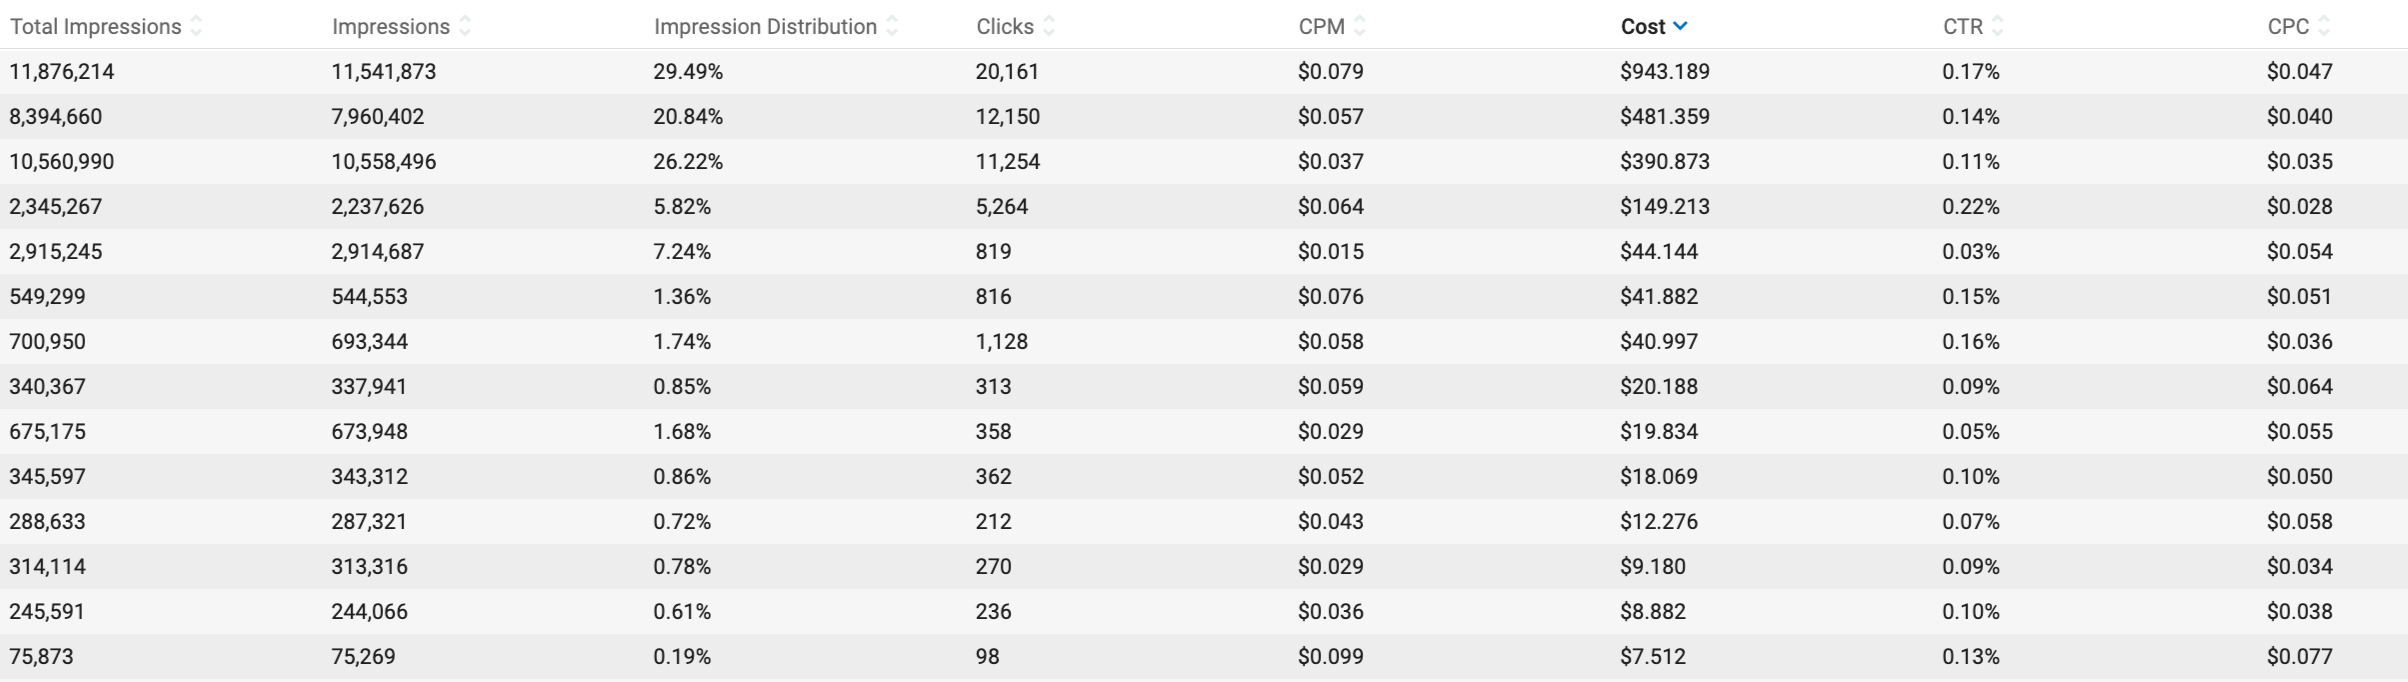
The General Panel displays the following metrics:
| Metric | Description |
|---|---|
| Impressions | Number of ad impressions |
| Total Impressions | Sum of regular and video impressions |
| Impression Distribution | The proportion of Total impressions this specific dimension corresponds to |
| Clicks | Number of ad clicks |
| CPM | Cost Per Mille |
| CPC | Cost Per Click |
| CTR | Click through rate |
| Revenue | Revenue achieved. |
The Video Panel
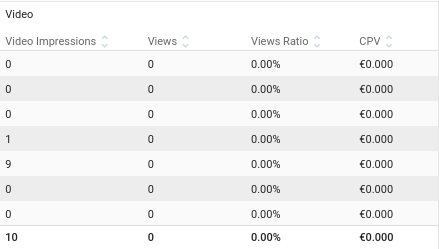
The Video Panel displays the following metrics:
| Metric | Description |
|---|---|
| Video Impressions | Number of video ad impressions |
| Views | Number of video ad views (a video ad view happens after 10 seconds of video playback) |
| CPV | Cost Per View |
| Views Ratio | Number of video views to the number of impressions |
The Push Notifications panel
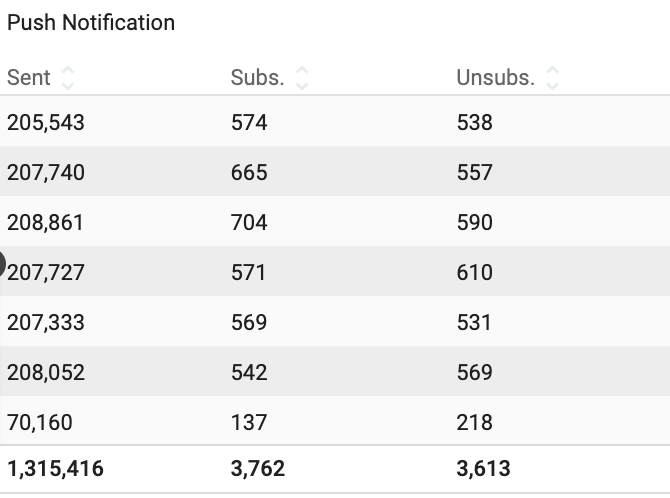
The Push Notification panel displays the following metrics
| Metric | Description |
|---|---|
| Sent | Number of push messages sent to users' devices. |
| Subs. | Number of users who accepted to receive Push Notifications |
| Unsubs. | Number of users who have been removed and will not receive Push Notifications anymore. |
The Real Time Bidding Panel
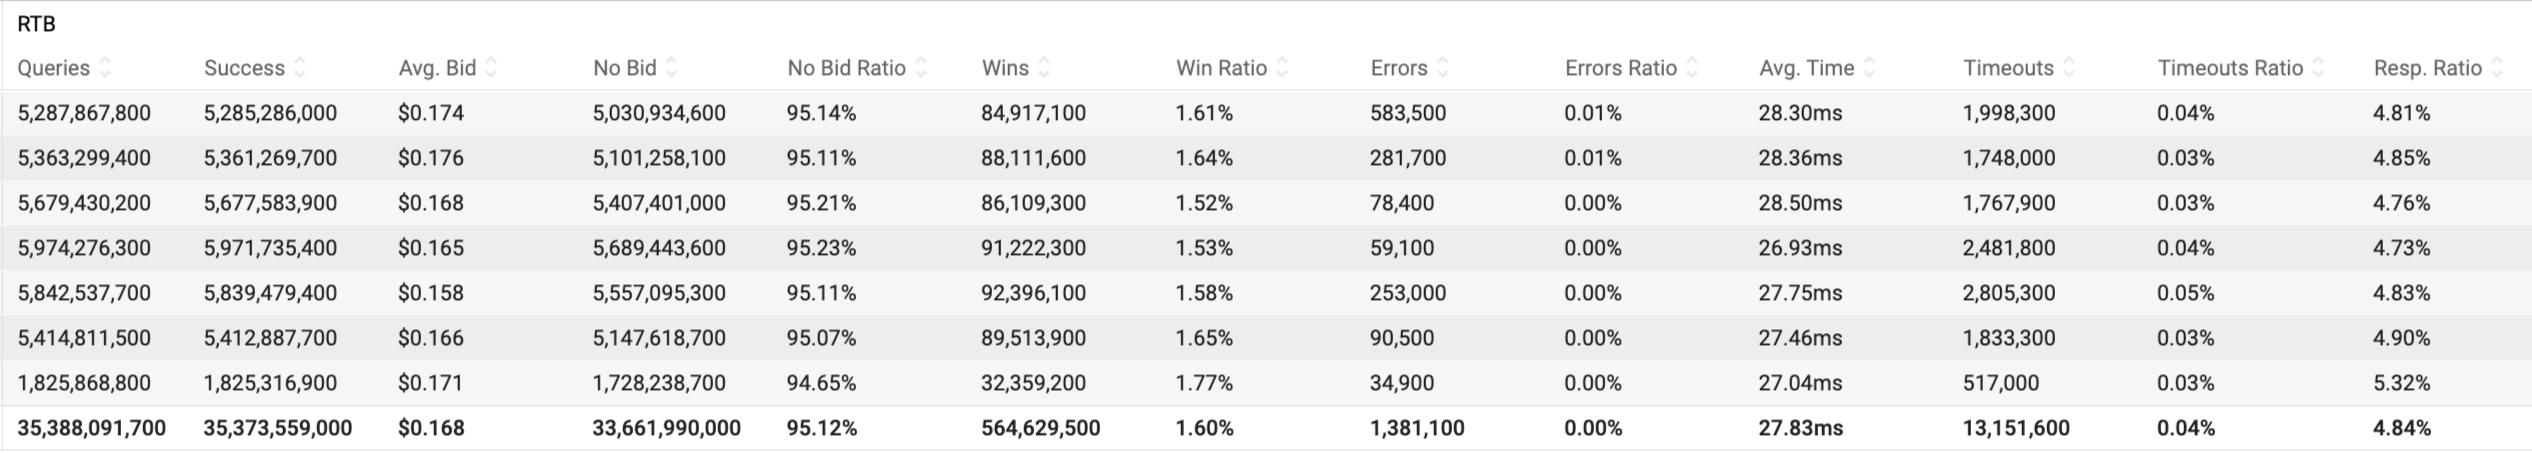
If you have Real Time Bidding enabled in your account, then you can enable the Real Time Bidding Panel in the statistics.
The Real Time Bidding panel displays the following metrics:
| Metric | Description |
|---|---|
| Average Bid | Average bid registered for your queries. |
| Average Time | Average time taken between a request and response. |
| Errors | Number of bid requests that did not go through the bidding process due to some errors. |
| Errors Ratio | Percentage of bid requests with errors against the total number of queries. |
| No Bid | Number of bid requests that didn't return a bid. |
| No Bid Ratio | Percentage of requests that did not make it to the bid, against the total number of queries. |
| Queries | Number of bid requests you sent. |
| Resp. Ratio | Percentage of bid responses out of the total number of bid requests. |
| Success | Number of bid requests that were successful and received a response with no errors. |
| Timeout | Number of requests that timed out |
| Timeout Ratio | Percentage of requests that have timed out against the total number of queries. |
| Win | Number of bid requests that won the auction. |
| Win Ratio | Percentage of wins against the total number of queries. |
Notes:
- If the Bid Response Ratio is 0%, this means you are sending requests but either advertisers are not bidding for them or there is an error in your requests. Check the No Bid ratio to find out if advertisers are interested in your traffic and check the Errors and Timeout Ratios to check whether there is something wrong with the integration.
- If you have a high Skipped ratio, then this means that your queries are being throttled to avoid server saturation. Usually, a high Skipped ratio happens after your initial queries (that is, when you started sending traffic through your zones) had a high amount of errors. If that is the case, please review your requests to fix any errors that might lead to this situation. If you need assistance to review this, please contact your account manager.
Toggle Options
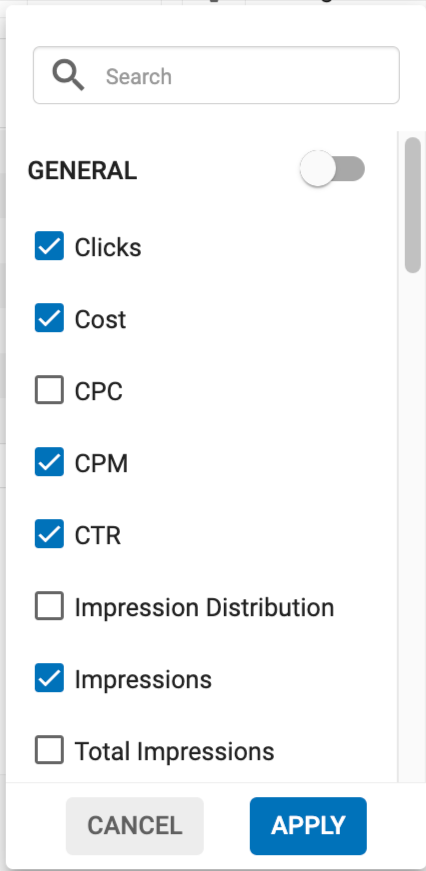
The Toggle Settings are found at the top right of the Table Data Panel. You can use these settings to toggle on/off specific columns or panels from the Table Data.
Downloading the data
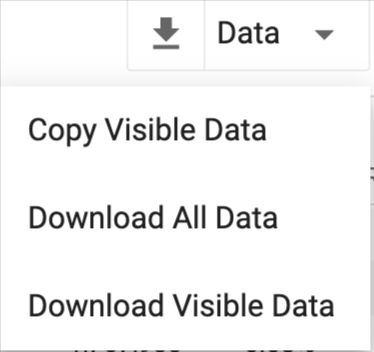
You can click on the Data button next to the settings to download the data. You have 3 options:
- Choose Download Visible Data to download just the data that is visible in the table. This will download only the columns that you have chosen to see using the toggle settings for General, Video, Conversions, Real Time Bidding Panels.
- Choose Download All Data to download all the available data. This will download everything regardless of what you have chosen to see in the table.
- Choose Copy Visible Data option to copy the data in your clipboard so that you can paste it elsewhere. This will copy only the columns that you have chosen to see using the toggle settings for General, Video, Conversions, Real Time Bidding Panels.