Estatísticas
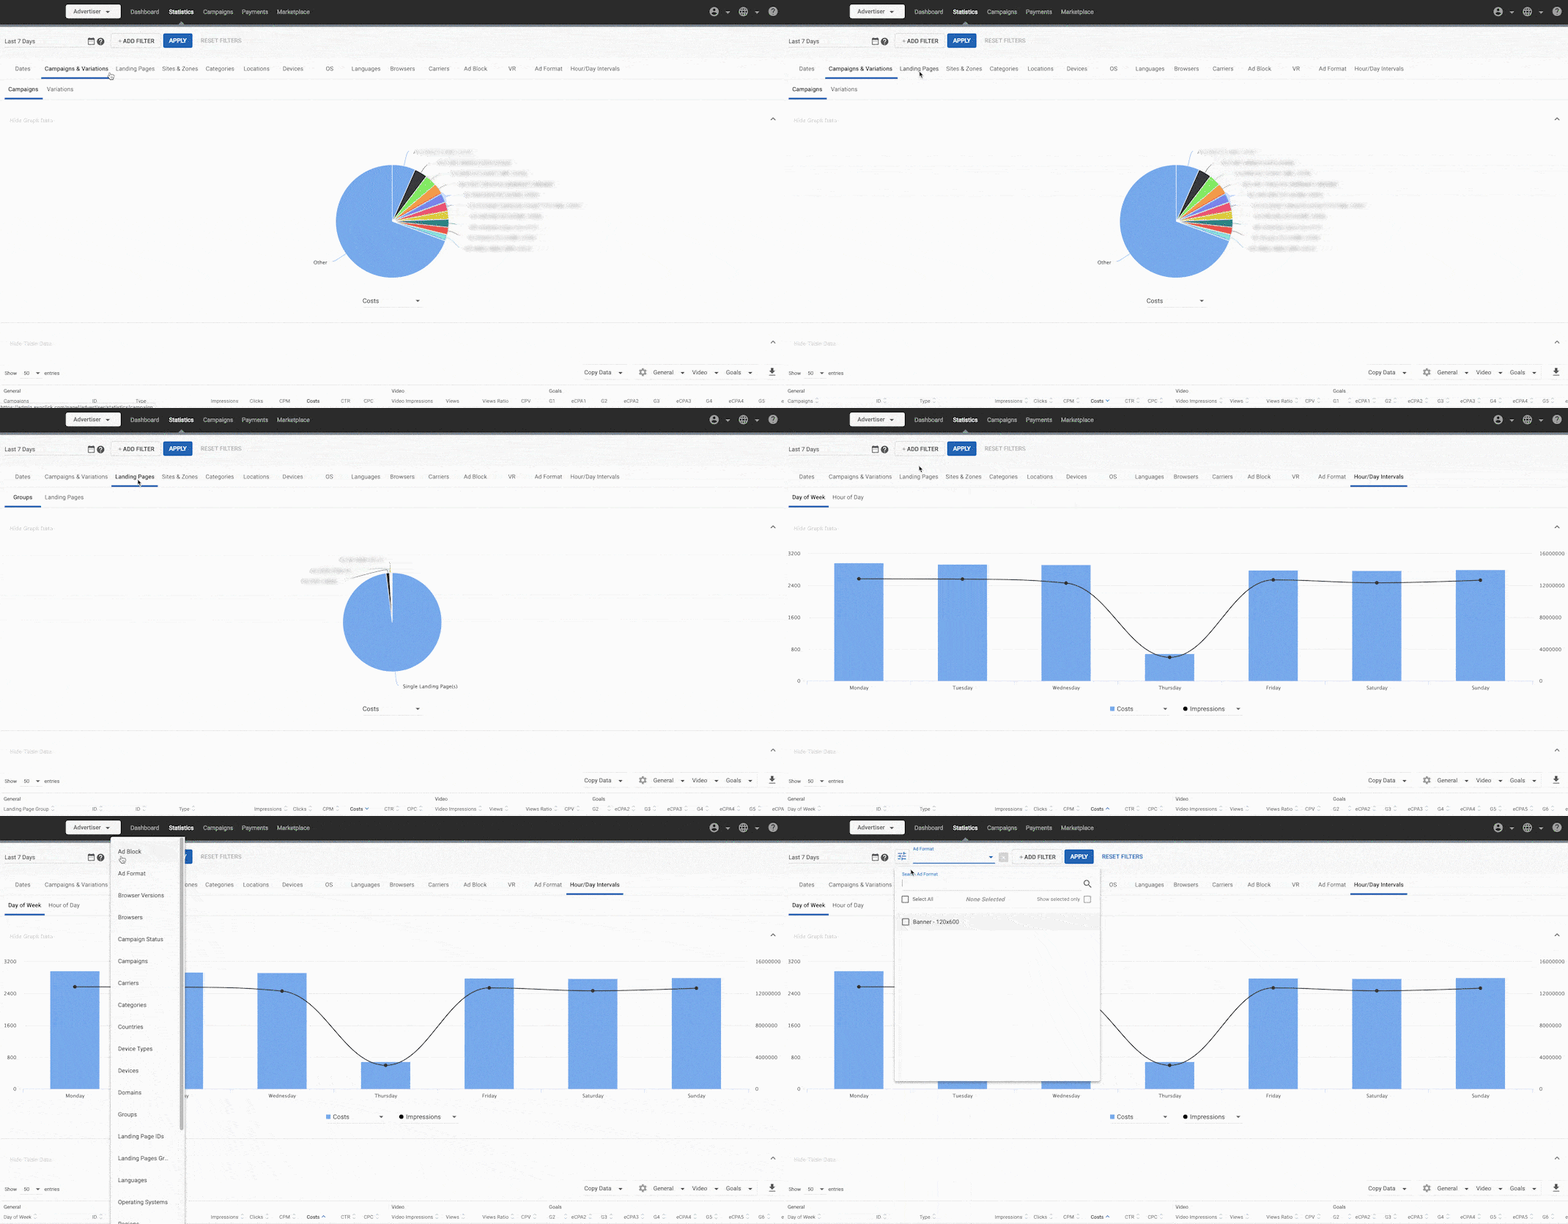
O separador Estatísticas mostra-lhe uma vasta gama de informações sobre as suas campanhas. Permite-lhe obter informações sobre o desempenho das suas campanhas e diagnosticar problemas quando estes ocorrem. O painel Gráfico de dados na parte superior do ecrã mostra gráficos de dados relacionados com as suas campanhas, enquanto o painel Tabela de dados na parte inferior mostra tabelas de dados importantes para datas recentes, bem como o custo de alcançar conversões selecionadas.
As informações no separador Estatísticas estão divididas em vários separadores: Datas, Campanhas e variações, Landing Pages, Sites e zonas, Categorias, Localizações, Dispositivos, OS, Idiomas, Navegadores, Transportadoras, Blocos de anúncios, VR e Intervalos de hora/dia.

Os dados são apresentados no fuso horário de Nova Iorque (EST ou EDT). O único separador onde se utiliza um fuso horário diferente é o sub- separador Hora dentro de Datas. Nesta desagregação, pode alterar o fuso horário das estatísticas selecionando o país correspondente no canto inferior direito do gráfico neste separador, escolhendo o fuso horário correspondente (se existirem vários) e clicando em "Aplicar":
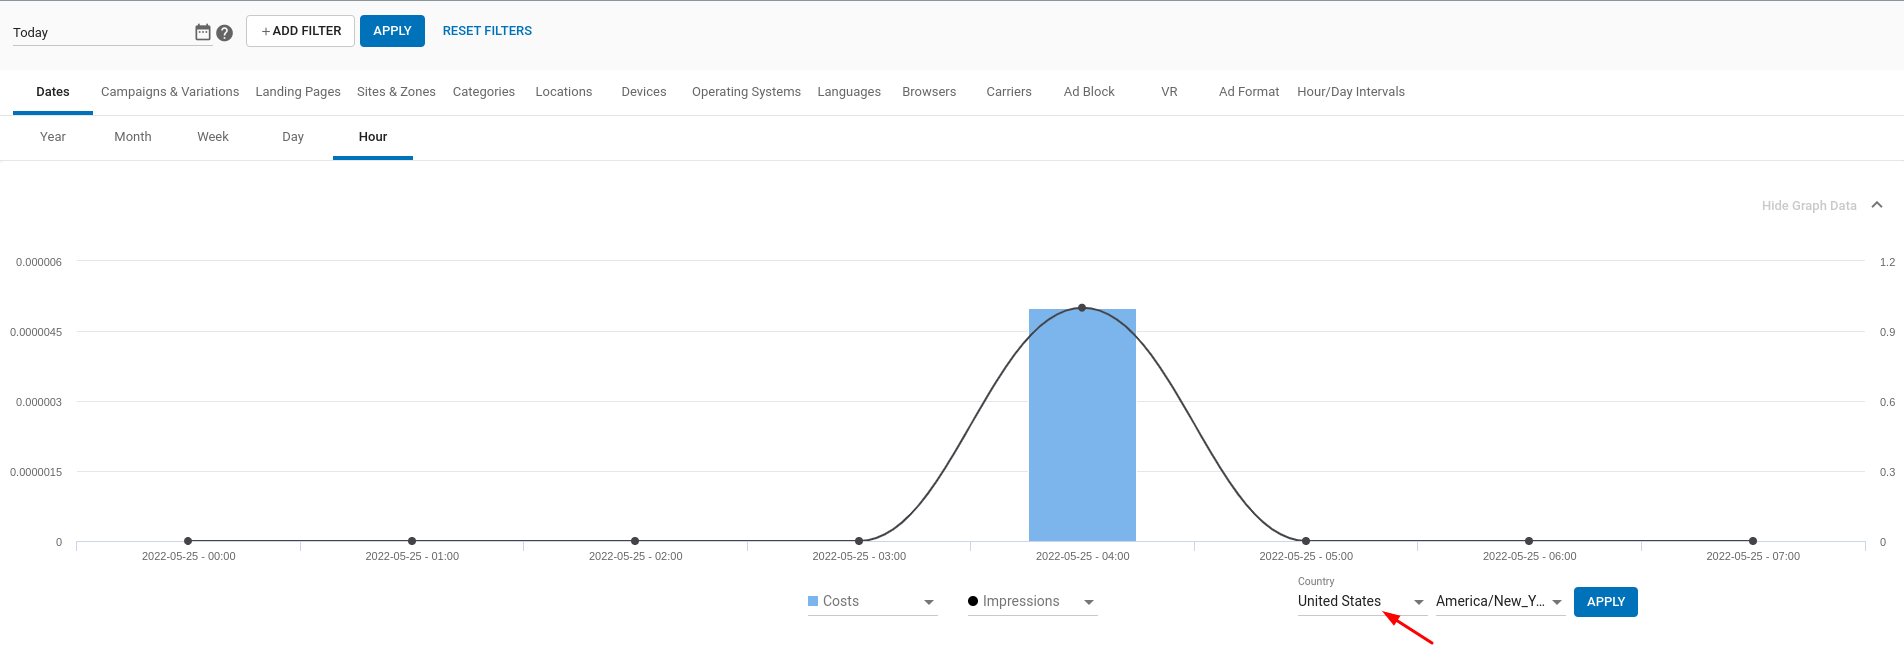
Nota: Os dados horários estão disponíveis até aos últimos 30 dias de dados.
Dimensões disponíveis
Segue-se a lista de todas as dimensões disponíveis para os anunciantes:
| *Grupo | **Nome da dimensão | **Valores |
|---|---|---|
| **Datas | Ano, Mês, Semana, Dia, Hora. | |
| **Campanhas e variações | **Campanhas | Contém valores como definidos em Campaign Name. |
| **Variações | Variações de anúncios carregadas para campanhas. | |
| **Páginas de destino | *Grupos | Contém valores para destinos de anúncios definidos ao criar campanhas. |
| **Página de destino | Contém valores para destinos de anúncios definidos ao criar campanhas. | |
| **Sítios e zonas | Domínios | Contém valores para os domínios do editor. |
| **Tipos de sítios | Contém valores para os tipos de sítios. | |
| **Sítios | Contém valores para nomes de sítios. | |
| **Zonas de publicidade | Contém valores para nomes de zonas. | |
| Sub IDs | Contém valores para números de SubIDs. | |
| Categorias | Categorias | Contém as categorias das páginas onde o anúncio foi apresentado. |
| **Localizações | **Países | Contém valores para países de acordo com o endereço IP. |
| **Regiões | Contém valores para regiões de acordo com o endereço IP. | |
| **Dispositivos | **Tipo de dispositivo | Contém valores para tipos de dispositivos como Desktop, Móvel, Smart TV, Consola, etc. |
| **Dispositivos | Contém valores para dispositivos no formato de tipo de dispositivo e nome do fabricante, como Mobile-Iphone, Mobile-Samsung, Tablet-iPad, etc. | |
| **Sistemas operativos | Contém valores para os sistemas operativos utilizados nos dispositivos onde os anúncios foram solicitados. | |
| **Línguas | Contém valores para as línguas dos utilizadores finais. | |
| **Navegadores | Contém valores para os browsers dos utilizadores finais. | |
| **Transportadoras | Contém valores para as operadoras móveis dos utilizadores finais. | |
| **Bloco de anúncios | Utilizadores finais com ou sem software AdBlock ativado | |
| **Utilizadores VR | Utilizadores finais que solicitam anúncios através de RV. | |
| **Formato do anúncio | **Formato do anúncio | Contém valores para os formatos de anúncio em que o anúncio foi apresentado. |
| **Tipos de zonas | Contém valores para os tipos de zona onde o anúncio foi apresentado. | |
| **Intervalos de horas/dias | **Dia da semana | Contém valores para os dias da semana. |
| **Hora do dia | Contém valores para as horas do dia. | |
| **Tipo de tráfego | Contém valores para a categorização do tráfego com base na qualidade do tráfego: RON, Premium, Área de Membros, etc. | |
| Proxy | Contém valores para o tipo de ligação dos utilizadores finais | |
| **Estado de verificação da idade | Contém valores que indicam se o utilizador verificou ou não a sua idade |
Adicionar filtros e determinar o Período de tempo dos dados
Pode adicionar filtros aos seus dados para obter uma visão mais pormenorizada dos seus resultados. Para filtrar o separador atualmente selecionado com base no segmento pretendido, clique no botão +ADICIONAR FILTRO e selecione o(s) item(ns) que pretende filtrar.
Também pode alterar o Período de tempo dos seus dados. As estatísticas mostram os Últimos 7 dias por defeito, mas pode escolher um período diferente clicando no ícone do calendário à esquerda do botão +ADICIONAR FILTRO. Pode escolher uma data tão antiga como os últimos dois anos.
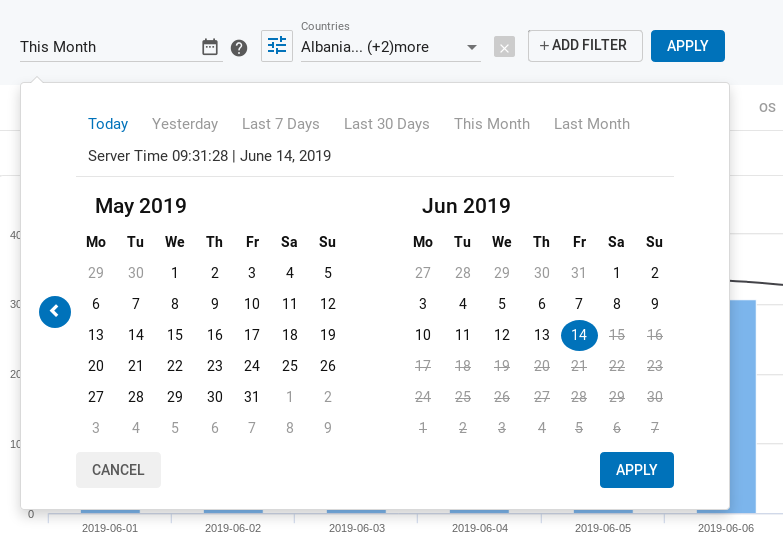
Também é possível fazer uma análise detalhada dos dados no painel Dados de tabela. Se clicar numa linha de dados específica, esse segmento será adicionado como um filtro à seleção de filtros existente e permanecerá em todos os outros separadores Estatísticas para os quais navegar.
Os filtros e o período de tempo podem ser revertidos para as predefinições premindo o botão Repor filtros.
Definições do filtro
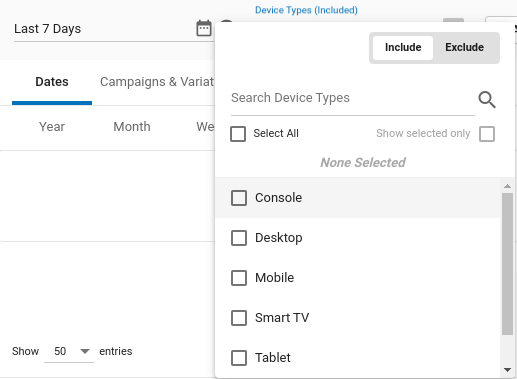
Ao adicionar um filtro, pode Incluir ou Excluir esse filtro.
Quando optar por Incluir um filtro, limitará os dados para mostrar apenas os segmentos que correspondem às condições do filtro. Por exemplo, se optar por Incluir o navegador Chrome e o SO Android, verá apenas o tráfego que pertence a esse navegador e SO específicos.
Se optar por Excluir um filtro, removerá todos os dados que correspondam a qualquer uma das condições especificadas. Por exemplo, se optar por excluir o navegador Chrome e o sistema operativo Android, não verá qualquer tráfego proveniente desse navegador ou desse sistema operativo.
Pode procurar itens específicos dentro do filtro escolhido utilizando a barra de pesquisa. Também pode selecionar todos os itens disponíveis no filtro, clicando na caixa de verificação Selecionar tudo. Por último, pode rever todas as opções selecionadas, clicando na caixa de verificação Mostrar apenas os selecionados.
Guardar o conjunto de filtros personalizados
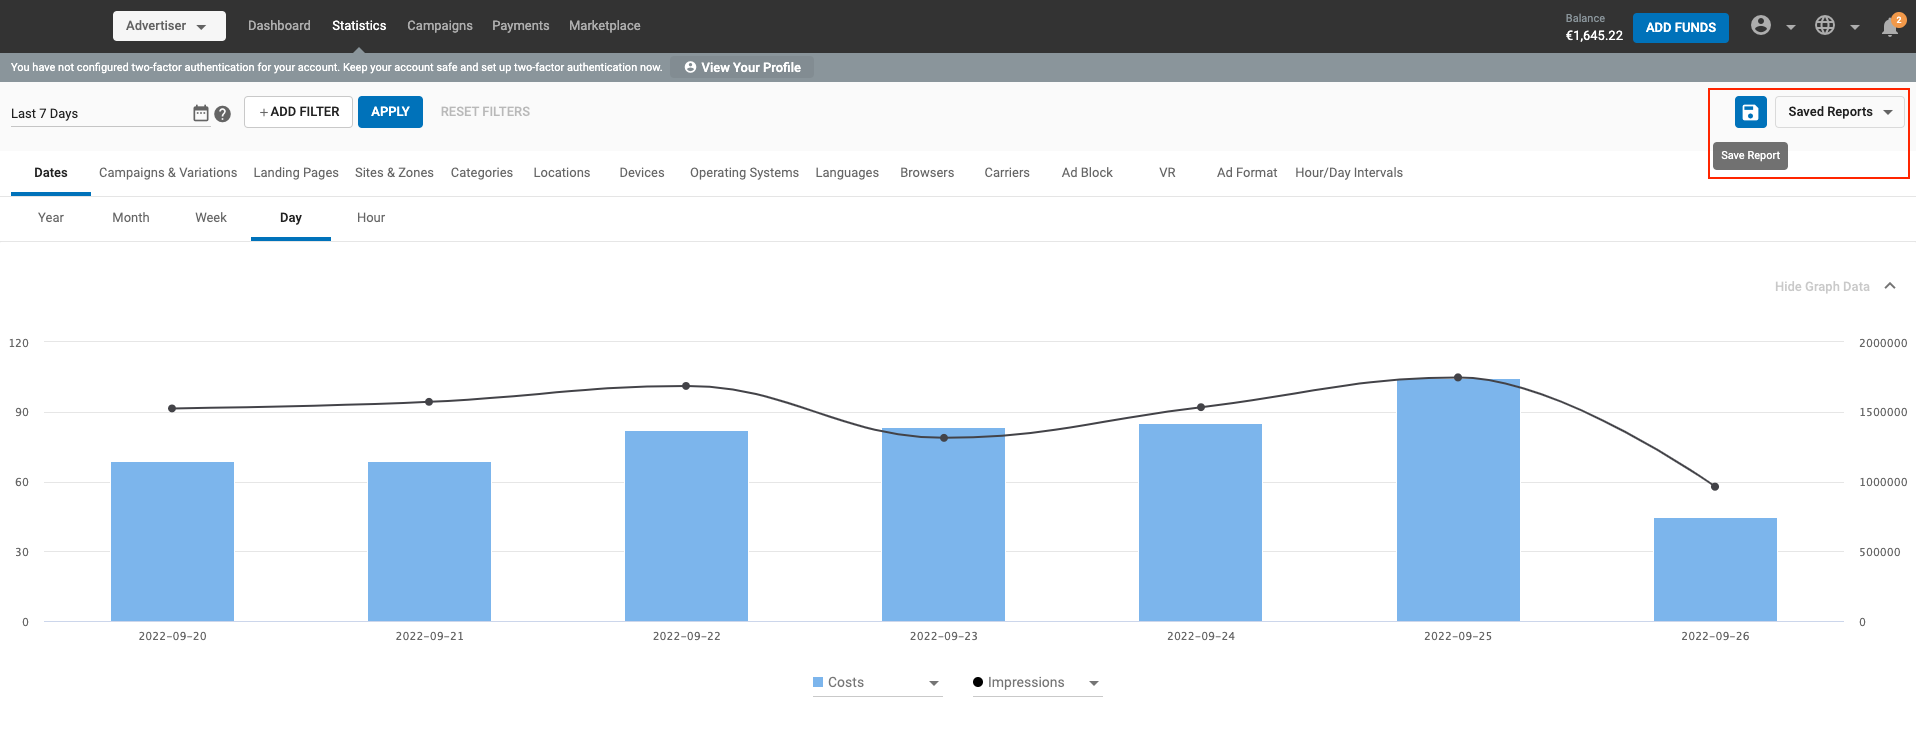
Utilizando a opção Guardar relatório, pode guardar conjuntos de filtros na página de estatísticas, dar a este conjunto de filtros um nome personalizado e escolher a partir de uma lista de conjuntos de filtros guardados anteriormente.
Guardar um relatório
Como utilizador, a vista predefinida do separador de estatísticas não terá quaisquer filtros aplicados. Pode guardar um relatório de filtros adicionando alguns filtros à sua escolha ou escolher a partir da lista de filtros já guardados para obter a vista pretendida.
Observações:
- A página Estatísticas será reiniciada quando sair para ir para outra página no Painel de administração.
- Pode ver a lista de filtros guardados no menu pendente Relatórios guardados.
- A ordem de ordenação dos relatórios Guardados será a mais recente criada no topo.
Atualizar o relatório existente ou Guardar como um novo relatório
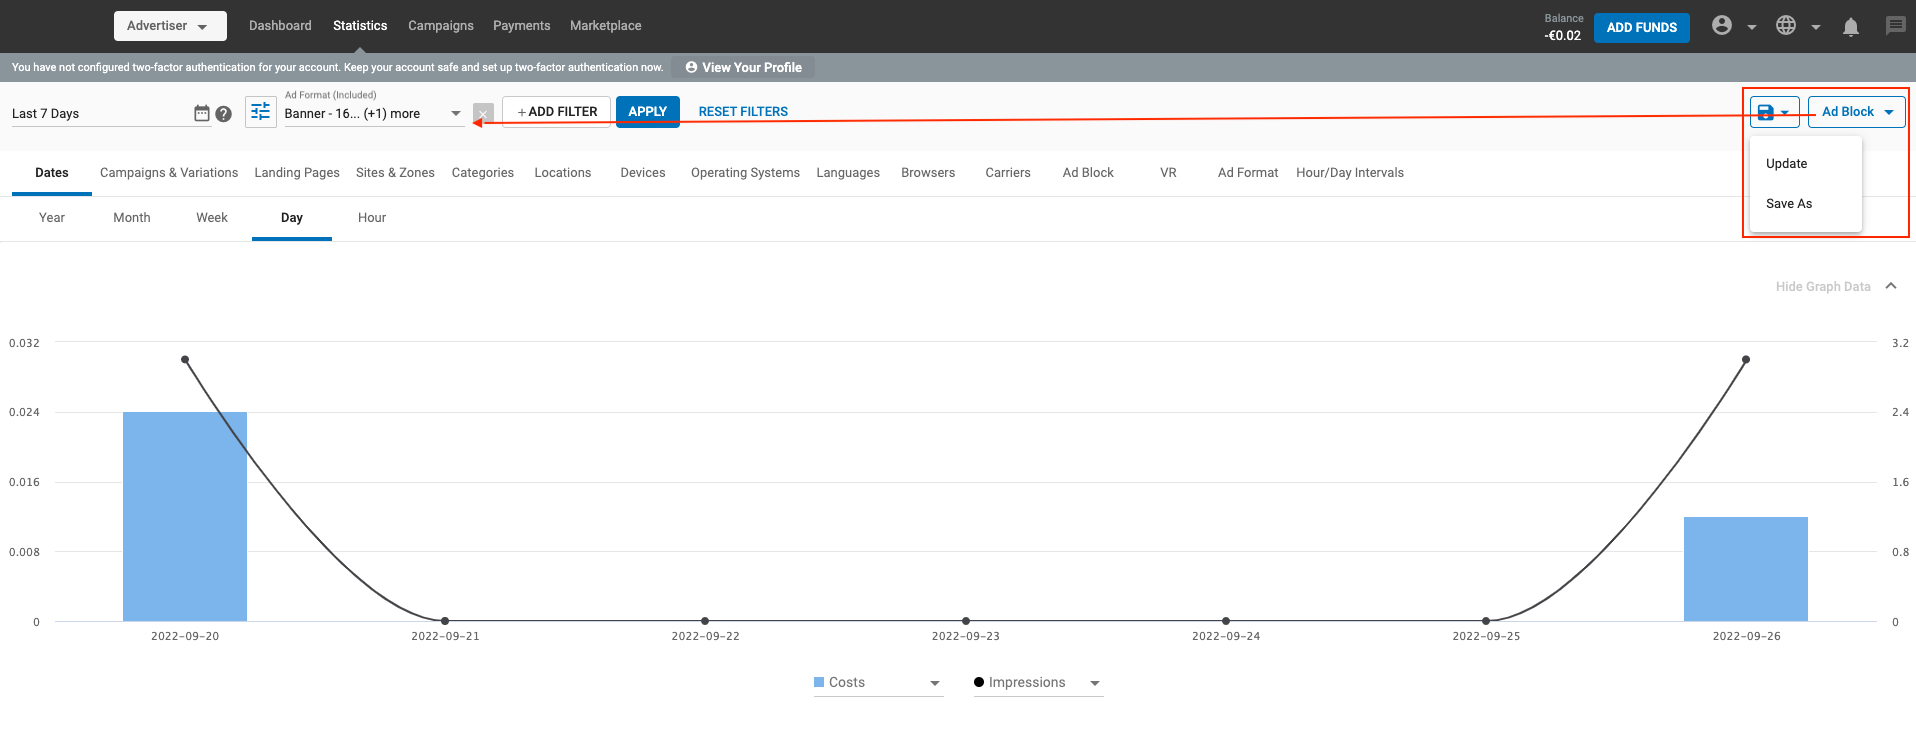
**Atualização
- Pode atualizar um relatório guardado existente selecionando-o, alterando os filtros e, em seguida, clicando no botão Atualizar.
- A definição do filtro será actualizada e guardada no Relatório guardado escolhido.
**Guardar como
- Também pode guardar um conjunto de filtros existente com outro nome, clicando na opção Guardar como.
- Ou pode também Guardar como um novo relatório, adicionando ou removendo alguns filtros deste conjunto.
Renomear, eliminar um relatório guardado
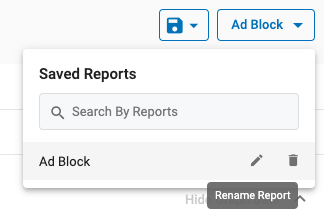
Utilizando os botões de ação em cada relatório guardado no menu pendente Relatório guardado, pode editar ou eliminar um relatório.
- O ícone do lápis ajuda a mudar o nome de um relatório guardado. Tenha em atenção que não podem existir dois relatórios com o mesmo nome.
- O ícone do contentor ajuda a eliminar um relatório guardado. Nota: uma vez eliminado um relatório, não é possível anular esta ação.
O painel de dados do gráfico
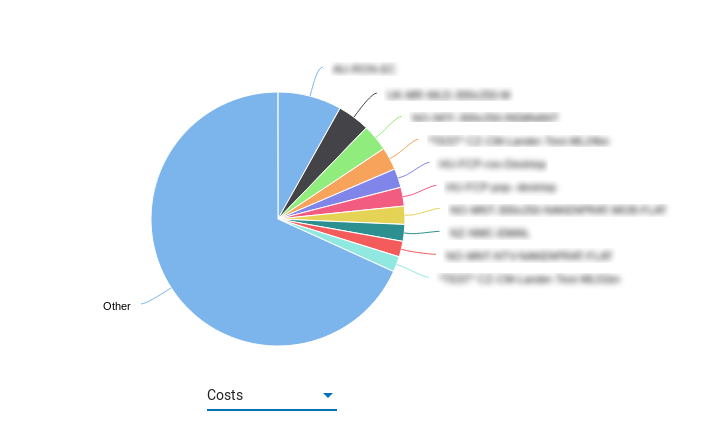
Para qualquer um dos separadores do separador Estatísticas, pode escolher as informações que pretende ver nos gráficos na metade superior do ecrã:
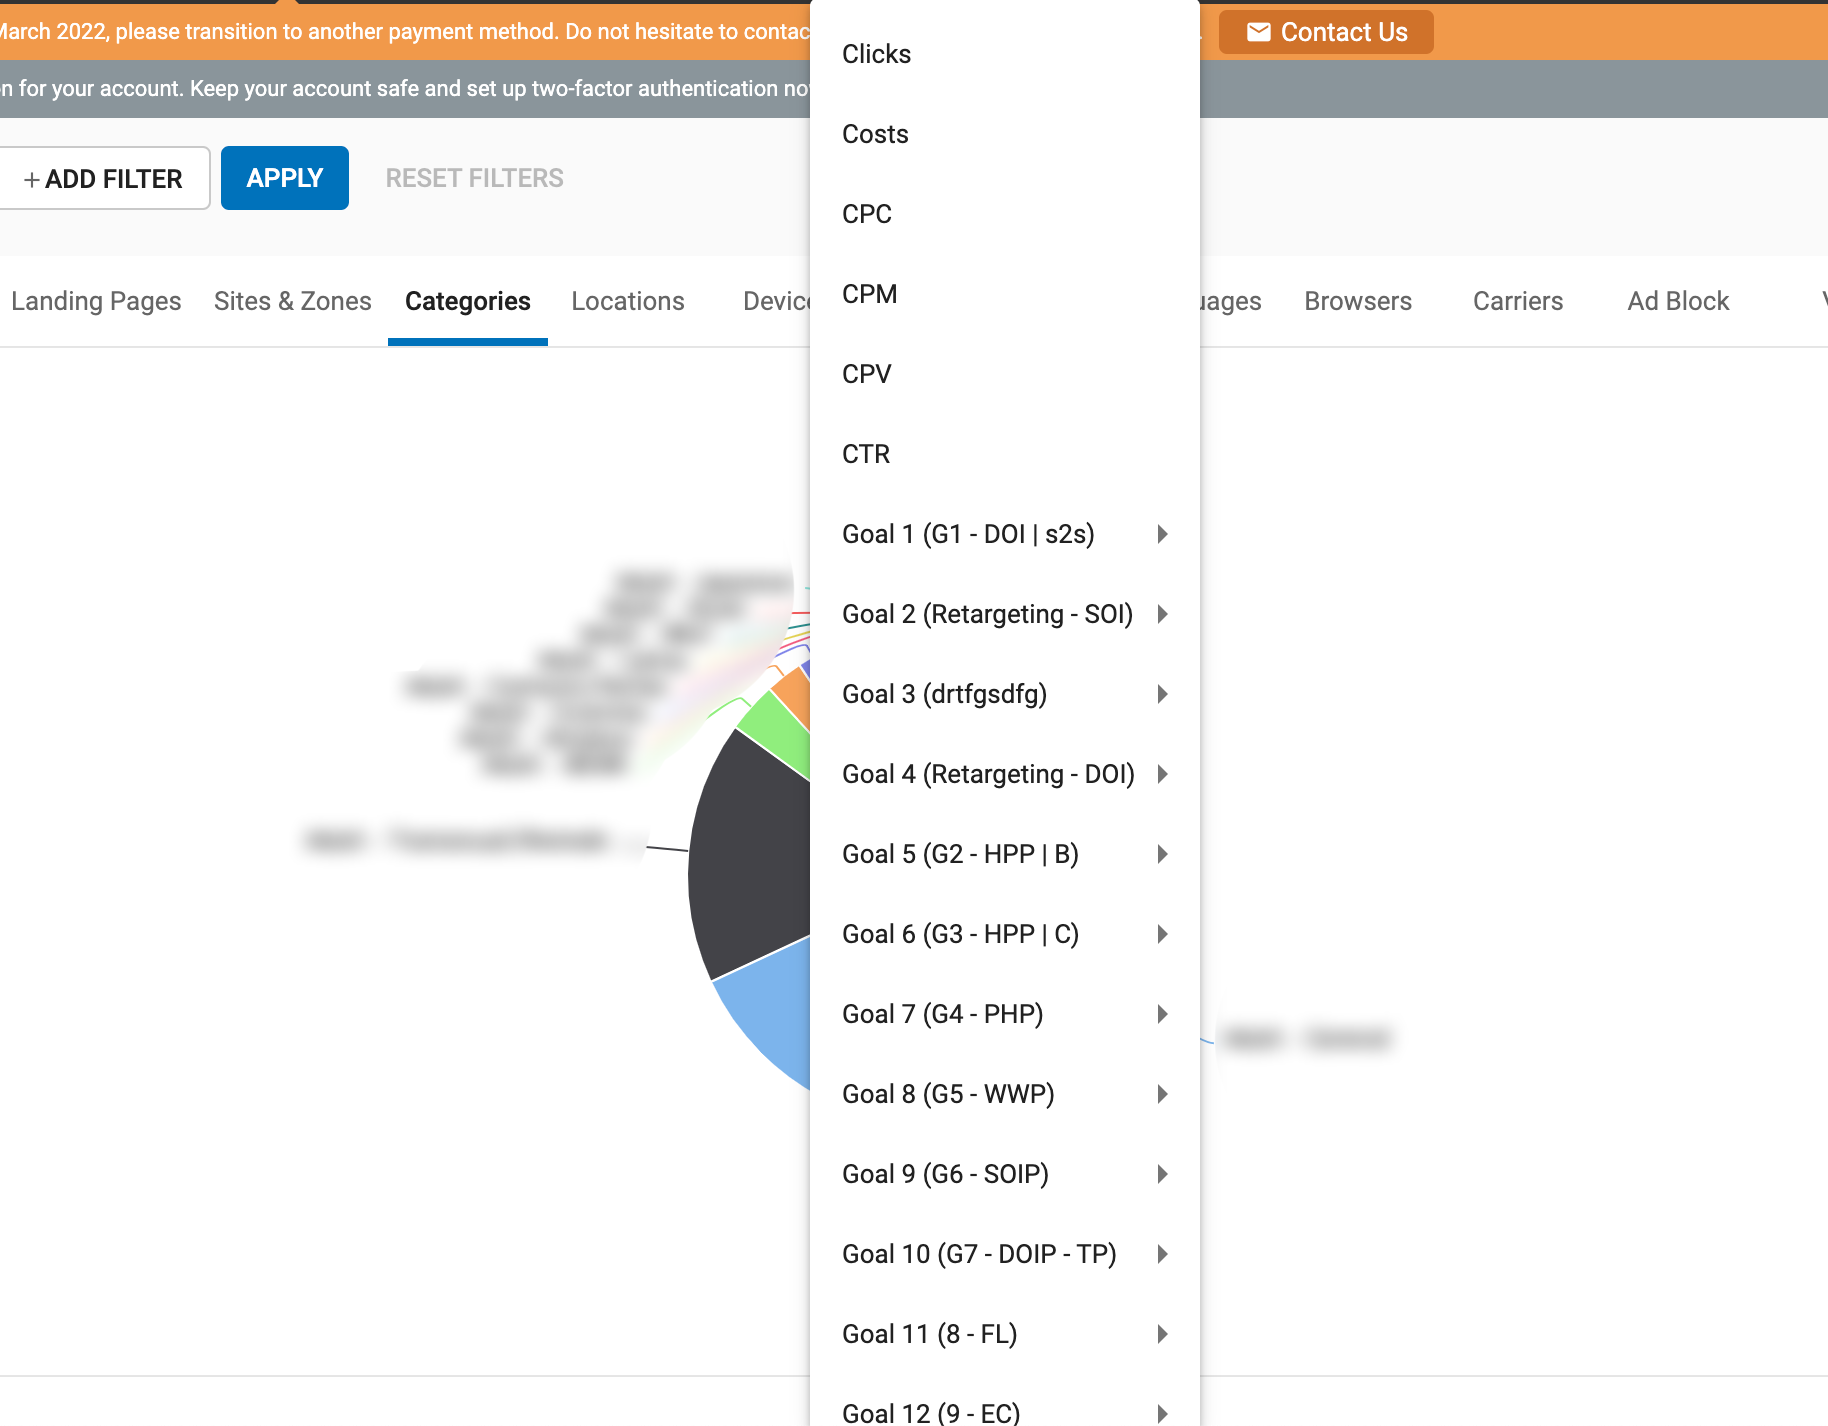
Todos os separadores do separador Estatísticas permitem-lhe visualizar gráficos de Custos, CPC, Cliques, Impressões, Impressões de vídeo, Visualizações, Razão de visualizações, CPV, CPM, CTR e Conversões. O tipo de gráfico varia consoante o separador:
- No separador Datas e no separador Intervalos de hora/dia, pode visualizar dois dos itens acima apresentados em dois gráficos de linhas e barras simultâneos. Para Datas, pode dividi-las por Hora, Dia, Semana, Mês ou Ano. Para Intervalos de hora/dia, pode dividi-los por Dia da semana e Hora do dia.
- Campanhas e variações, Landing Pages, Sites e zonas, Categorias, Dispositivos, Sistemas operativos, Idiomas, Navegadores, Transportadoras, Bloqueio de anúncios, VR e Formato de anúncios mostrarão um único gráfico de pizza com um menu pendente para selecionar a métrica da sua escolha.
- a opção Localizações mostra-lhe um mapa do mundo onde pode ver os seus dados repartidos por país. Pode aumentar ou diminuir o zoom do mapa utilizando os botões + e -** à esquerda.
A maioria dos separadores está dividida em sub-tabelas. Se clicar em itens no painel Geral, irá aceder ao sub separador relacionado. Por exemplo, se clicar numa campanha no painel Campanhas, acederá ao sub separador Variações, que mostra as variações dessa campanha.
O painel de dados da tabela

O painel Dados da tabela mostra os dados do gráfico em formato tabular. No menu suspenso Mostrar X entradas no canto superior direito do painel Dados da tabela, é possível escolher quantas linhas de dados deseja ver na tabela. Também pode clicar nas setas ao lado de qualquer um dos cabeçalhos de coluna e ordenar os dados do valor mais baixo para o mais alto.
Por predefinição, o painel Table Data contém apenas o painel General. No entanto, pode adicionar os painéis Vídeo, Conversões e RTB à direita do painel Geral através das Opções de alternância.
O Painel Geral
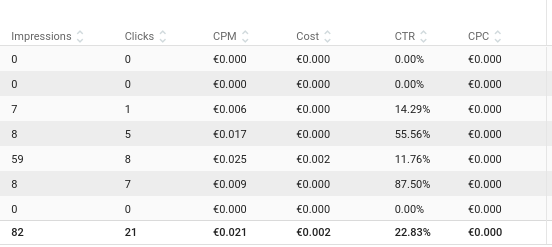
No painel Geral, verá o item para o qual está a visualizar dados na extrema esquerda e, à direita, os dados associados, incluindo Impressões, Cliques, CPM, Custos, CTR e CPC.
O painel de vídeo
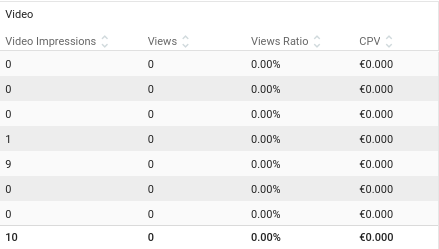
Se o intervalo dos dados selecionados incluir tráfego de Vídeo, também verá o painel Vídeo, que inclui Impressões de vídeo, Visualizações Razão de visualizações (que é a percentagem de visualizações com base nas impressões de vídeo) e o CPV.
Os painéis de acompanhamento de conversões e de objectivos de conversão

Os painéis Acompanhamento de conversões e Conversões mostram a quantidade de conversões que gerou e várias métricas adicionais que determinam a rentabilidade das suas campanhas. Enquanto o painel Acompanhamento de conversões mostra os resultados totais de todos os Objectivos de conversão na sua conta, o painel Conversões mostra as mesmas métricas para cada objetivo separadamente.
As métricas que pode ver nestes dois painéis são as seguintes:
- Cnvs.: mostra a quantidade total de conversões ou as conversões geradas para esse objetivo específico.
- eCPA (custo efetivo por ação): mostra o preço real que pagou para conseguir cada conversão.
- CR (Taxa de Conversão): número de conversões dividido pelo número de cliques.
- CV (Valor de Conversão): valor da conversão. Esta coluna mostrará o valor atribuído ao objetivo de conversão durante a sua configuração (se selecionou Valor fixo) ou indicará Dinâmico, caso tenha selecionado Valor dinâmico. Se definir o objetivo de conversão como Sem valor, esta coluna estará vazia. No painel de Acompanhamento de conversões, esta coluna devolverá uma média de todos os Valores de conversão dos objectivos que enviam esta informação.
As colunas seguintes só mostrarão dados se estiver a passar o valor da conversão:
- Receita: a soma do valor de todas as conversões geradas.
- Lucro: a receita menos o custo.
- ROI (Return On Investment): o seu lucro dividido pelo custo.
O lucro e o ROI podem aparecer em 3 cores diferentes:
- O número é VERDE: O ROI é superior a 0%. O seu retorno do investimento é positivo e está a pagar menos por cada conversão do que o seu COA.
- O número é PRETO: O ROI é igual a 0%. O seu retorno do investimento é quase OK. Verifique as estatísticas detalhadas da campanha para melhorar algumas fontes de tráfego.
- O número é VERMELHO: O ROI é inferior a 0%. O seu retorno do investimento é negativo e está a pagar mais por cada conversão do que pode pagar (mais do que o seu COA). Verifique se existem erros nas fontes de tráfego e na configuração da sua campanha.
Cada coluna nos painéis Controlo de conversões e Conversões pode ser ordenada da mais alta para a mais baixa utilizando as setas no topo de cada coluna.
O Painel de Licitações em Tempo Real

O painel Licitação em tempo real mostra as estatísticas de várias métricas relacionadas obtidas através de leilões em tempo real que ocorrem quando um anúncio é solicitado por uma página.
- Licitação média é o montante médio registado para as suas licitações.
- Tempo médio mostra o tempo médio decorrido entre um pedido e uma resposta.
- Erros mostra o número de pedidos de licitação que não passaram pelo processo de licitação devido a alguns erros.
- O rácio de erros mostra a percentagem de pedidos de propostas com erros em relação ao número total de consultas.
- Sem Proposta mostra o número de pedidos de cotação aos quais não respondeu.
- O rácio sem licitação mostra a percentagem de pedidos que não chegaram à licitação em relação ao número total de consultas.
- Consultas mostra o número de pedidos de cotação que recebeu.
- Ignorado mostra o número de pedidos de cotação que foram automaticamente limitados pelo sistema.
- O rácio de saltos mostra a percentagem de pedidos saltados em relação ao número total de consultas.
- Sucesso mostra o número de pedidos de cotação que foram bem sucedidos e receberam uma resposta sem erros.
- Timeouts mostra o número de pedidos de cotação que foram expirados sem resposta.
- O rácio de tempo limite mostra a percentagem de pedidos que atingiram o tempo limite em relação ao número total de consultas.
- Vitórias mostra o número de pedidos de cotação que ganharam o leilão.
- O rácio de vitórias mostra a percentagem de vitórias em relação ao número total de consultas.
Opções de alternância
As opções de alternância encontram-se no canto superior direito do painel Dados da tabela.
- Ao clicar no menu pendente Geral, pode ativar e desativar as métricas gerais nos dados do painel Geral: Data, Impressões, Cliques, CPM, Custos, CTR, CPC.
- Ao clicar no menu pendente Vídeo, pode ativar e desativar as métricas relacionadas com o vídeo no painel Vídeo: Impressões, Visualizações, Razão de visualizações e CPV. Pode ativar/desativar todas as métricas de vídeo utilizando o botão de alternância Vídeo.
- Ao clicar no menu pendente Conversões, pode ativar e desativar as métricas relacionadas com a conversão no painel Conversões: Cnvs, eCPA, CR, CV, Revenue, Profit e ROI. Pode ativar/desativar todas as métricas de conversões utilizando o botão de alternância Conversões e pode ativar/desativar todas as colunas de um objetivo de conversão específico clicando no quadrado branco junto ao nome da conversão.
- Ao clicar no menu pendente Licitação em tempo real, pode ativar e desativar as métricas relacionadas com RTB no painel Licitação em tempo real: CPM médio, Tempo médio, Erros, Razão de erros, Sem lance, Razão de lances, Consultas, Resp. Rácio, Skipped, Rácio de Skipped, Success, Timeouts, Rácio de Timeouts, Rácio de Win, Wins. Pode ativar/desativar todas as métricas de conversões utilizando o botão de alternância RTB.
Descarregar um ficheiro CSV das suas estatísticas
Pode clicar no botão Transferir CSV, que tem duas opções:

- Selecione Download de dados visíveis para descarregar apenas os dados visíveis na tabela. Isto só descarrega as colunas que escolheu ver utilizando as definições de alternância dos painéis Geral, Vídeo, Conversões, Licitação em tempo real.
- Selecione Download de todos os dados para descarregar todos os dados disponíveis. Isto irá descarregar tudo, independentemente do que tiver escolhido para ver na tabela.
Copiar dados visíveis

Também pode copiar os dados na Tabela de Dados para os poder colar noutro local, como uma folha de Excel. Acima da Tabela de dados verá a opção Copiar dados visíveis. Esta opção copiará apenas as colunas que escolheu ver utilizando as definições de alternância para os painéis Geral, Vídeo, Conversões, Licitação em tempo real.
Gerir campanhas através de estatísticas
A página Estatísticas oferece vários botões de acesso rápido para o ajudar a navegar no painel de administração enquanto gere as suas campanhas.
No separador Campanhas e Variações > Campanhas, pode aceder às definições de campanha de qualquer campanha apresentada nas estatísticas premindo o botão Editar no Tabela de dados, junto ao nome da campanha:
No separador Campanhas e variações > Variações, pode fazer uma pausa nas variações premindo o botão Pausa no painel Dados da tabela.
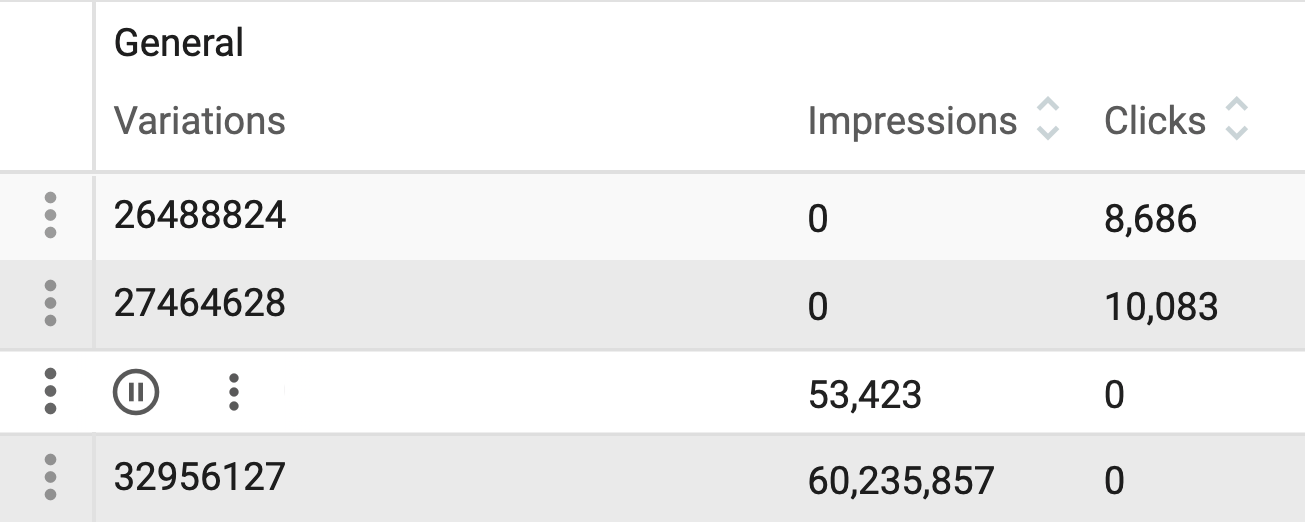
Se estiver a filtrar as suas estatísticas por uma campanha específica, também pode aceder às definições dessa campanha premindo o botão Editar campanha junto às definições do filtro:

Por último, no separador Sites e zonas > Zonas e filtrando as estatísticas por uma campanha específica, pode bloquear zonas e removê-las da sua campanha premindo o botão Pausa no painel Dados da tabela.
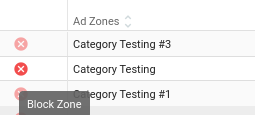
Observações:
- Se colocar em pausa a única variação em execução da sua campanha, o estado da campanha será alterado para Não será executada, uma vez que não existem variações disponíveis para mostrar.
- O bloqueio de zonas através de estatísticas pode alterar o direcionamento de zonas da sua campanha. Se estiver a orientar ou bloquear uma zona na sua campanha e a desativar ou ativar na sua campanha, a orientação da campanha mudará para Todos.
Atualização das dimensões de segmentação através de estatísticas
Pode bloquear ou desbloquear dimensões de segmentação para a sua campanha no separador de estatísticas. Para o fazer, selecione uma única campanha utilizando "ADD FILTER". Terá então acesso às seguintes dimensões:
- Sítios
- Localizações
- Dispositivos
- Sistemas operativos
- Línguas
- Navegadores
- Operadores móveis
Para atualizar uma dimensão, navegue para o separador apropriado e procure o ícone de bloqueio/desbloqueio.
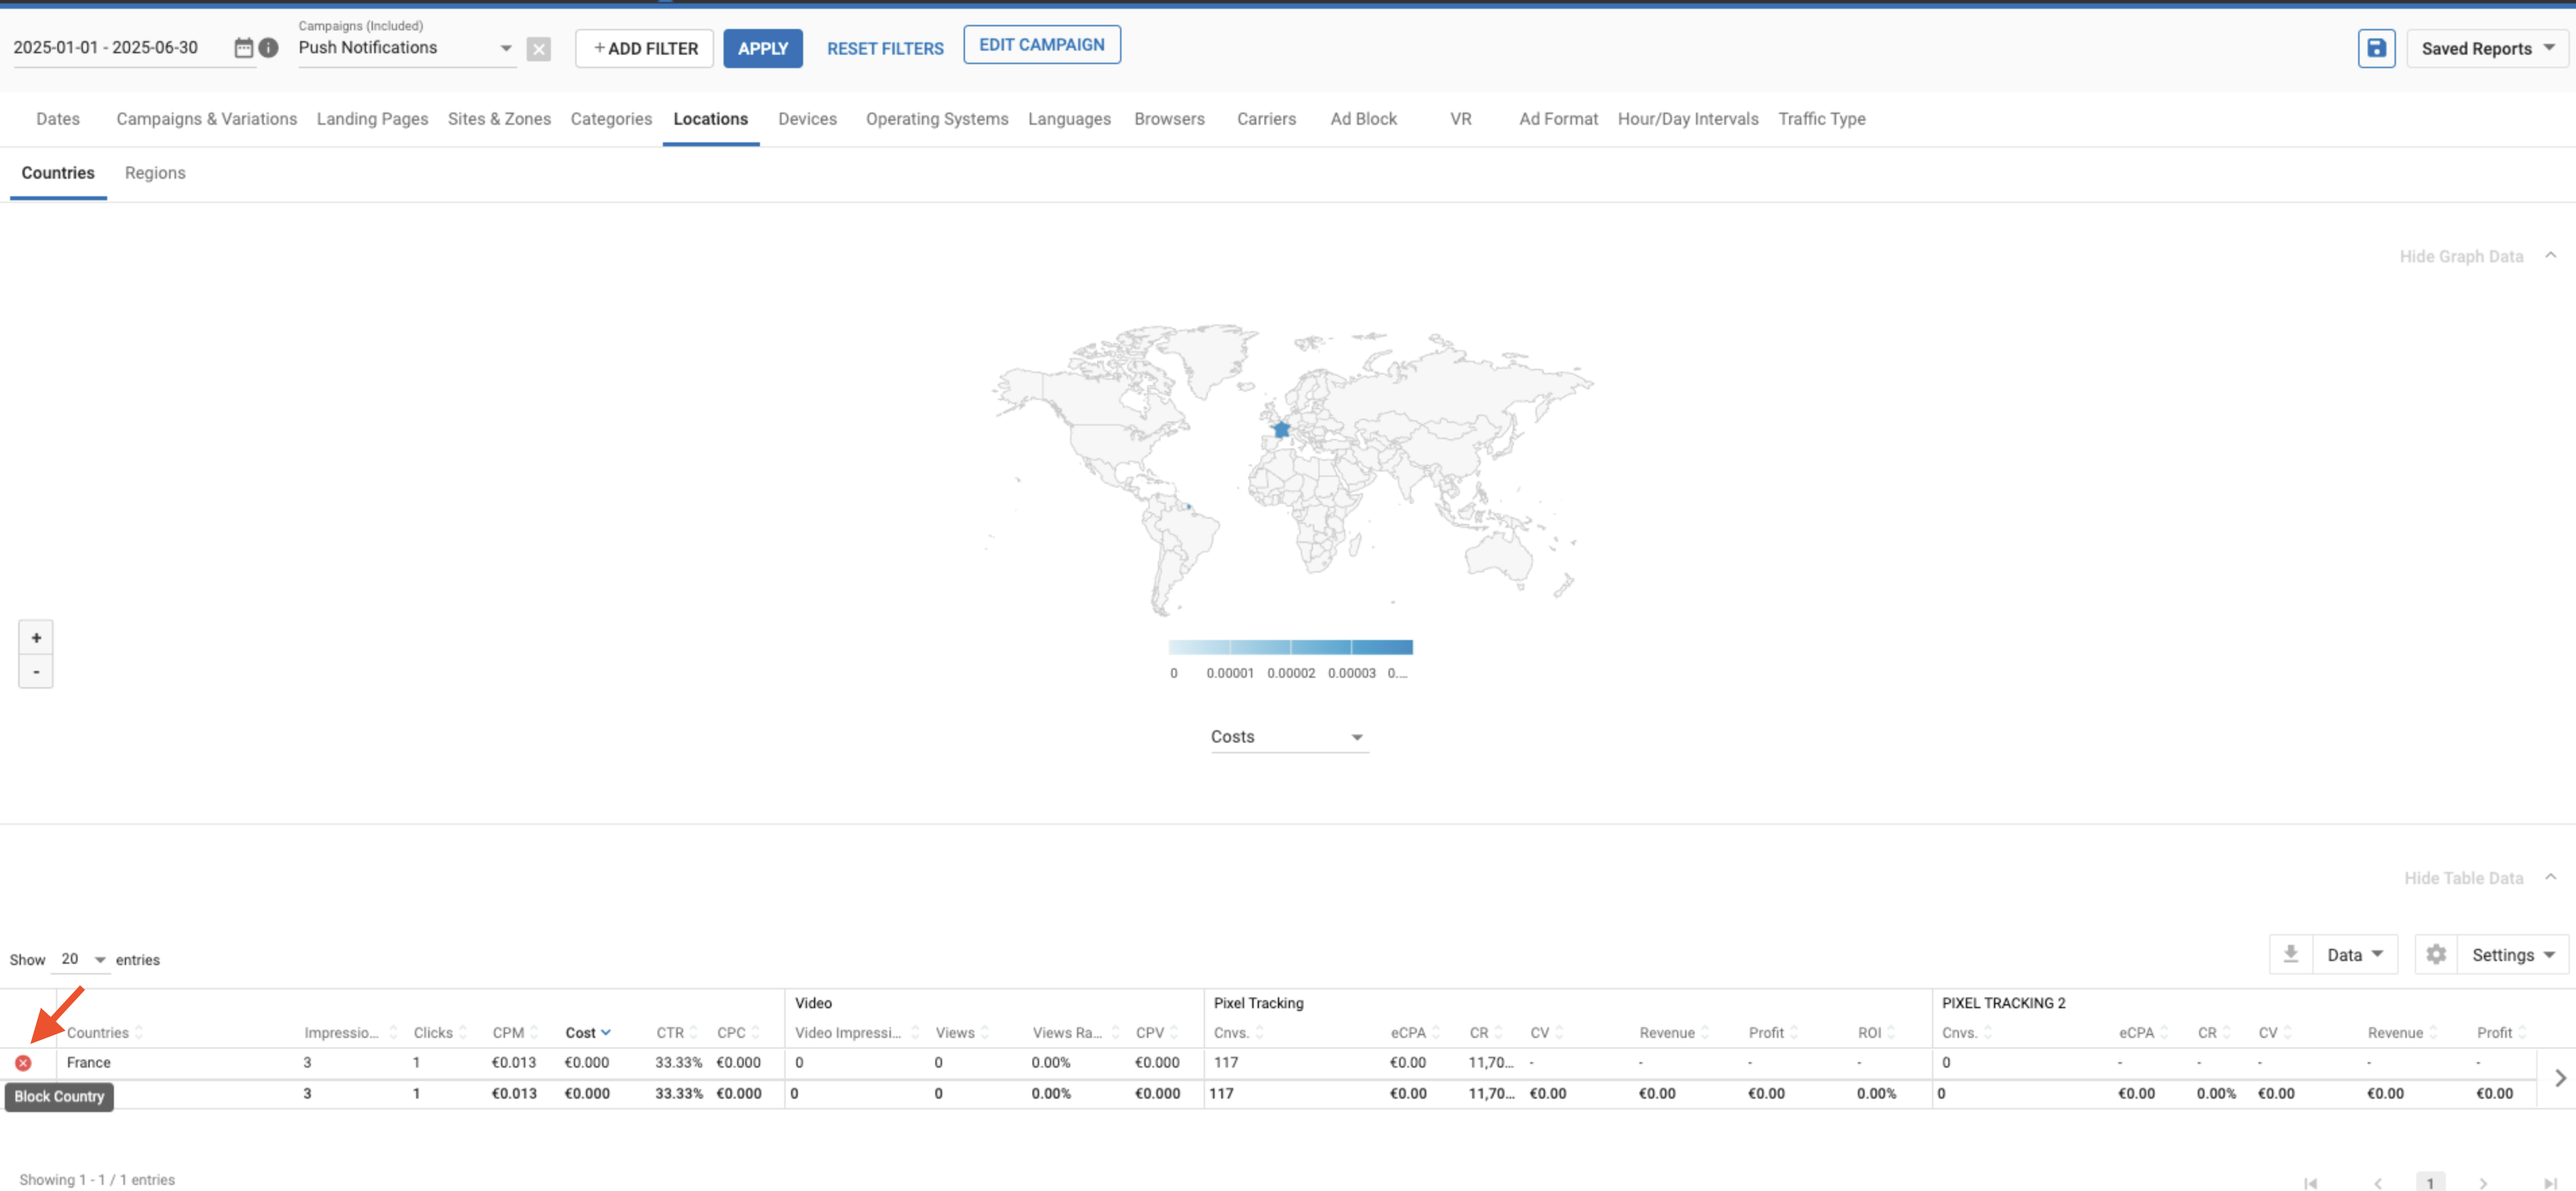
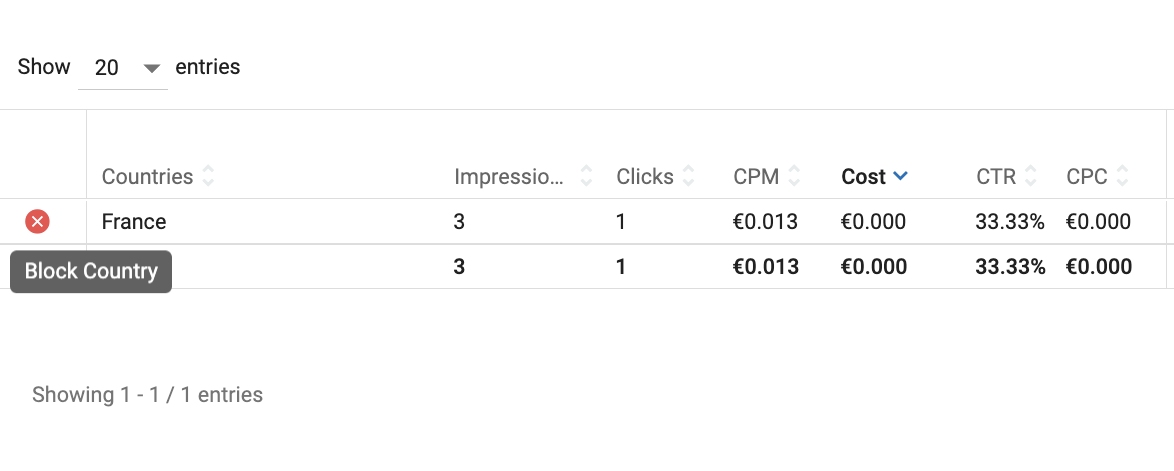
IMPORTANTE: Tem de selecionar uma única campanha utilizando o filtro para gerir as dimensões de segmentação. Estas opções não estão disponíveis quando são selecionadas várias campanhas.