Estadísticas
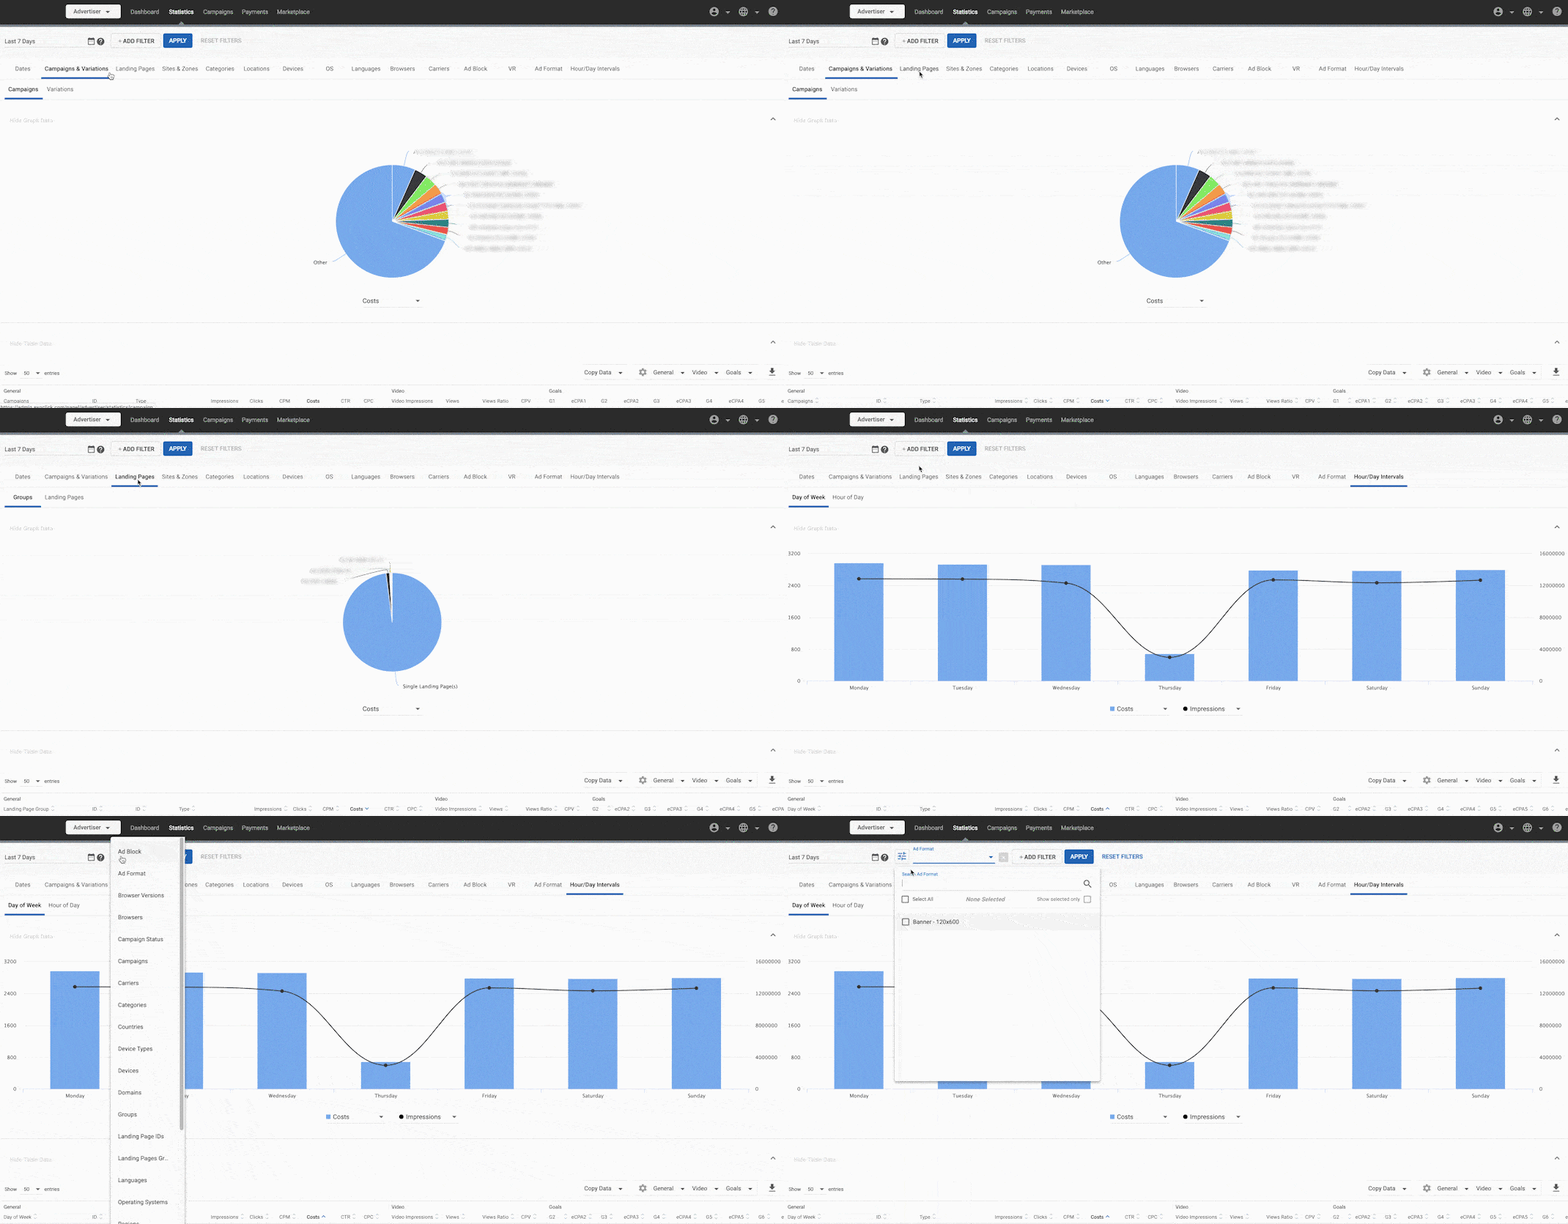
La pestaña Estadísticas le muestra una amplia gama de información sobre sus campañas. Le permite obtener información sobre el rendimiento de sus campañas y diagnosticar problemas cuando se produzcan. El panel Datos gráficos de la parte superior de la pantalla le muestra gráficos de datos relacionados con sus campañas, mientras que el panel Datos de tabla de la parte inferior le muestra tablas de datos importantes para fechas recientes, así como el coste de conseguir conversiones seleccionadas.
La información de la pestaña Estadísticas se desglosa en varias pestañas: Fechas, Campañas y variaciones, Páginas de destino, Sitios y zonas, Categorías, Ubicaciones, Dispositivos, OS, Idiomas, Navegadores, Operadores, Bloque de anuncios, VR e Intervalos de horas/días.

Los datos se muestran en la zona horaria Nueva York (EST o EDT). La única pestaña en la que se utiliza una zona horaria diferente es la subpestaña Hora dentro de Fechas. En este desglose, puede cambiar la zona horaria de las estadísticas seleccionando el país correspondiente en la parte inferior derecha del gráfico de esta pestaña, eligiendo la zona horaria correspondiente (si hay varias) y haciendo clic en "Aplicar":
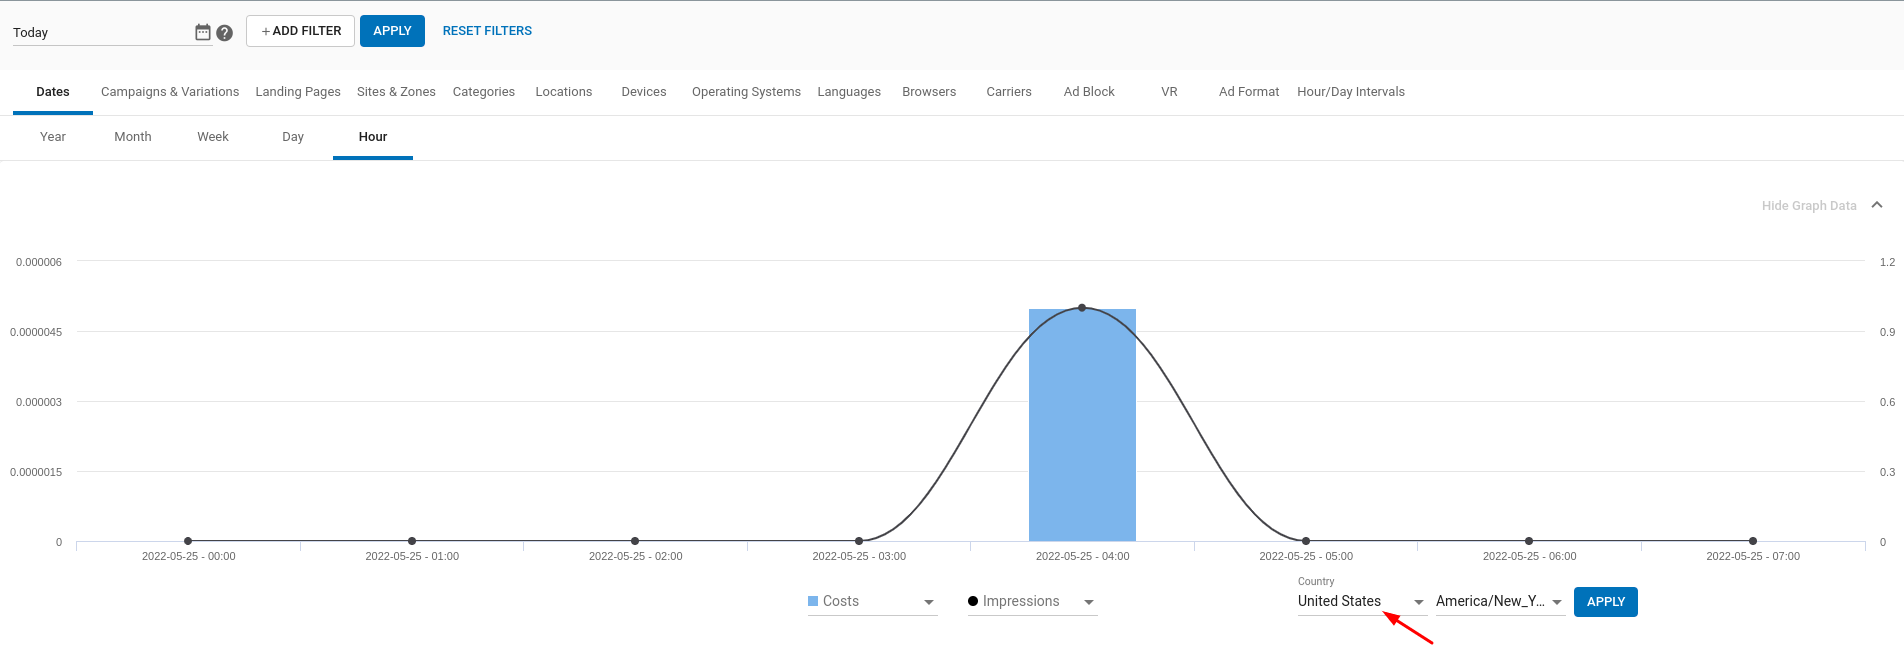
Nota: Los datos horarios están disponibles hasta los últimos 30 días de datos.
Dimensiones disponibles
A continuación figura la lista de todas las dimensiones disponibles para los anunciantes:
| Grupo | Nombre de la dimensión | Valores |
|---|---|---|
| Fechas | Año, Mes, Semana, Día, Hora. | |
| Campañas y variaciones | Campañas | Contiene los valores definidos en Nombre de campaña. |
| Variaciones | Variantes de anuncios cargadas para campañas. | |
| Páginas de aterrizaje | Grupos | Contiene valores para los destinos de anuncios establecidos al crear campañas. |
| Página de aterrizaje | Contiene valores para los destinos de anuncios establecidos al crear campañas. | |
| Sitios y zonas | Dominios | Contiene valores para los dominios del editor. |
| Tipos de sitio | Contiene valores para Tipos de sitio. | |
| Sitios | Contiene valores para los nombres de los sitios. | |
| Zonas Ad | Contiene valores para los nombres de Zona. | |
| Sub ID | Contiene valores para los números de SubIDs. | |
| Categorías | Categorías | Contiene las Categorías de las páginas donde se mostró el anuncio. |
| Localizaciones | Países | Contiene los valores de los países según la dirección IP. |
| Regiones | Contiene los valores de las regiones según la dirección IP. | |
| Dispositivos | Tipo de dispositivo | Contiene valores para los tipos de dispositivo, como escritorio, móvil, Smart TV, consola, etc. |
| Dispositivos | Contiene valores para dispositivos con el formato de tipo de dispositivo y nombre del fabricante, como Móvil-Iphone, Móvil-Samsung, Tablet-iPad, etc. | |
| Sistemas operativos | Contiene valores para los sistemas operativos utilizados en los dispositivos donde se solicitaron los anuncios. | |
| Idiomas | Contiene valores para los idiomas de los usuarios finales. | |
| Browsers | Contiene valores para los navegadores de los usuarios finales. | |
| Carriers | Contiene valores para los operadores móviles de los usuarios finales. | |
| Ad Block | Usuarios finales con o sin AdBlock activado | |
| Usuarios de VR | Usuarios finales que solicitan anuncios a través de RV. | |
| Ad Format | Ad Format | Contiene valores para los formatos de anuncios en los que se mostró el anuncio. |
| Tipos de zona | Contiene valores para los Tipos de zona donde se mostró el anuncio. | |
| Intervalos hora/día | Día de la semana | Contiene valores para los días de la semana. |
| Hora del día | Contiene valores para las horas del día. | |
| Tipo de tráfico | Contiene valores para la categorización del tráfico en función de la calidad del mismo: RON, Premium, Área de miembros, etc. | |
| Proxy | Contiene valores para el tipo de conexión de los usuarios finales | |
| Estado de verificación de la edad | Contiene valores que indican si el usuario ha verificado su edad o no |
Añadir filtros y determinar el periodo de tiempo de los datos
Puede añadir filtros a sus datos para obtener una visión más granular de sus resultados. Para filtrar la pestaña seleccionada en función del segmento deseado, haga clic en el botón +AÑADIR FILTRO y seleccione los elementos por los que desea filtrar.
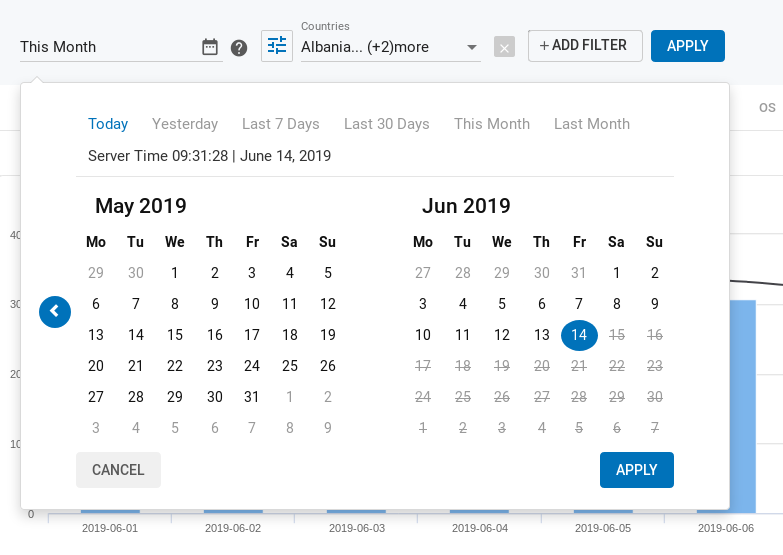
También puede cambiar el Periodo de tiempo de sus datos. Por defecto, las estadísticas muestran los Últimos 7 días, pero puedes elegir un periodo diferente haciendo clic en el icono del calendario situado a la izquierda del botón +AÑADIR FILTRO. Puede elegir una fecha tan lejana como los dos últimos años.
También puede desglosar sus datos en el panel Datos de tabla. Si hace clic en una fila de datos específica, ese segmento se añadirá como filtro a la selección de filtros existente y se mantendrá para el resto de pestañas de Estadísticas por las que navegue.
Los filtros y el periodo de tiempo se pueden restablecer pulsando el botón Restablecer filtros.
Ajustes del filtro
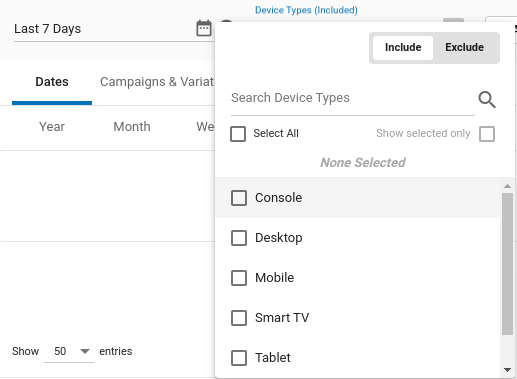
Al añadir un filtro, puede Incluir o Excluir ese filtro.
Cuando elija Incluir un filtro, limitará los datos para mostrar sólo los segmentos que coincidan con las condiciones del filtro. Por ejemplo, si elige Incluir navegador Chrome y sistema operativo Android, solo verá el tráfico que pertenezca a ese navegador y sistema operativo específicos.
Si elige Excluir un filtro, eliminará cualquier dato que coincida con cualquiera de las condiciones que especifique. Por ejemplo, si elige Excluir navegador Chrome y sistema operativo Android, no verá ningún tráfico procedente de ese navegador o de ese sistema operativo.
Puede buscar elementos específicos dentro del filtro elegido utilizando la barra de búsqueda. También puede seleccionar todos los elementos disponibles dentro del filtro haciendo clic en la casilla Seleccionar todo. Por último, puede revisar todas las opciones seleccionadas haciendo clic en la casilla Mostrar opciones seleccionadas.
Guardar conjunto de filtros personalizados
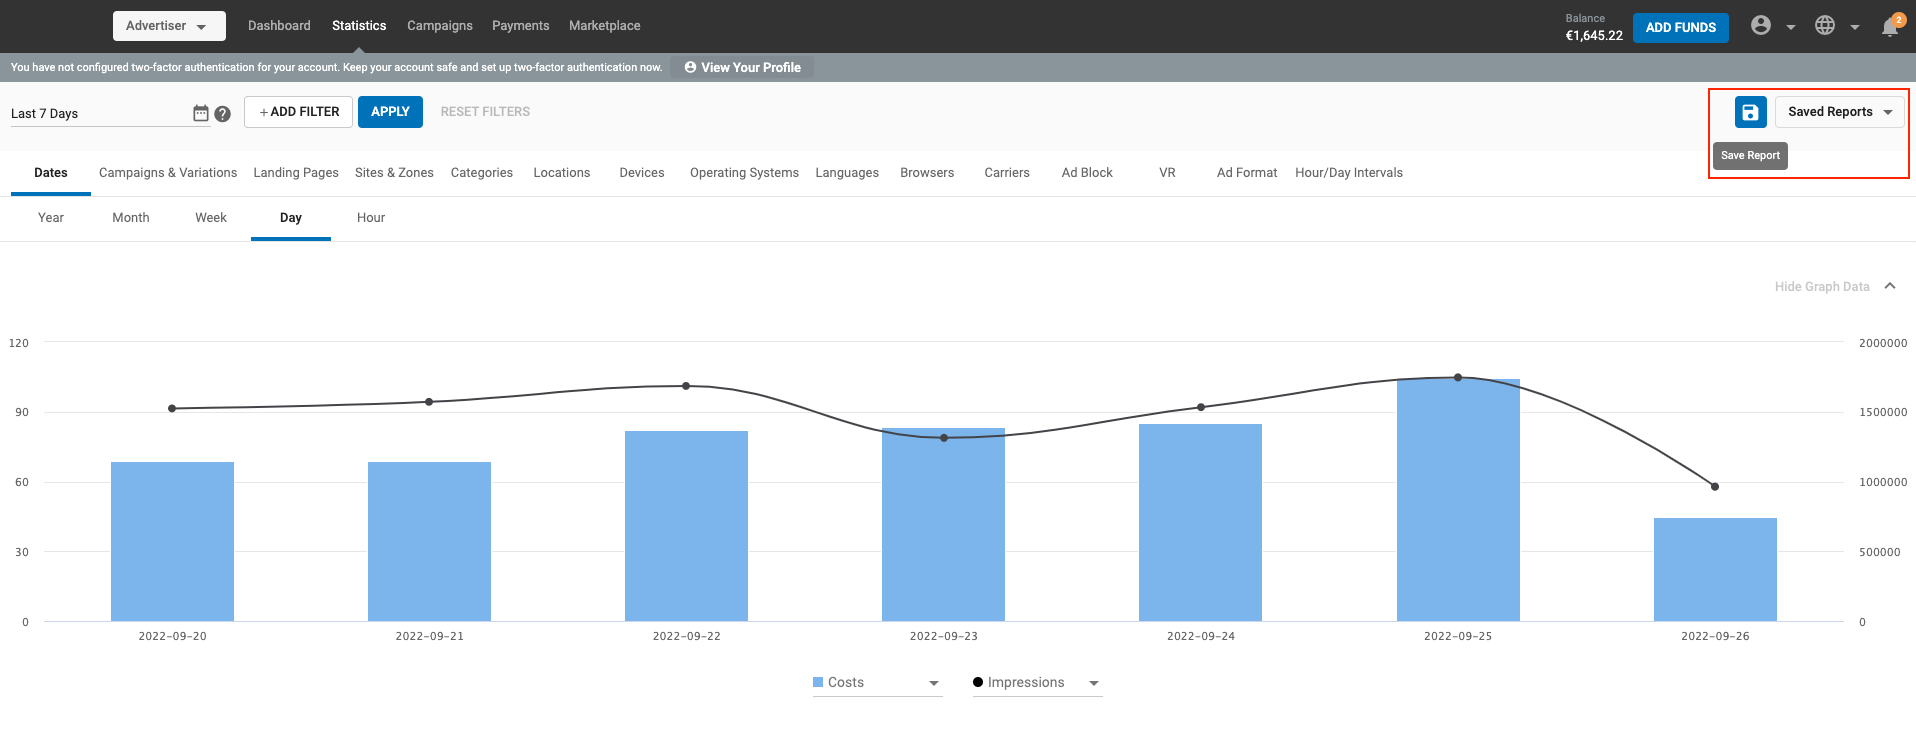
Mediante la opción Guardar informe, puede guardar conjuntos de filtros en la página de estadísticas, dar a este conjunto de filtros un nombre personalizado y elegir entre una lista de conjuntos de filtros guardados anteriormente.
Guardar un informe
Como usuario, la vista por defecto de la pestaña de estadísticas no tendrá ningún filtro aplicado. Puede guardar un informe filtrado añadiendo algunos filtros de su elección o elegir de la lista de filtros ya guardados para obtener la vista deseada.
Notas:
- La página de Estadísticas se restablecerá una vez que salga para ir a otra página en el Panel de Administración.
- Puede ver la lista de filtros guardados en el desplegable Informes guardados.
- El orden de clasificación de los informes guardados será el último creado en la parte superior.
Actualizar el informe existente o Guardar como nuevo informe
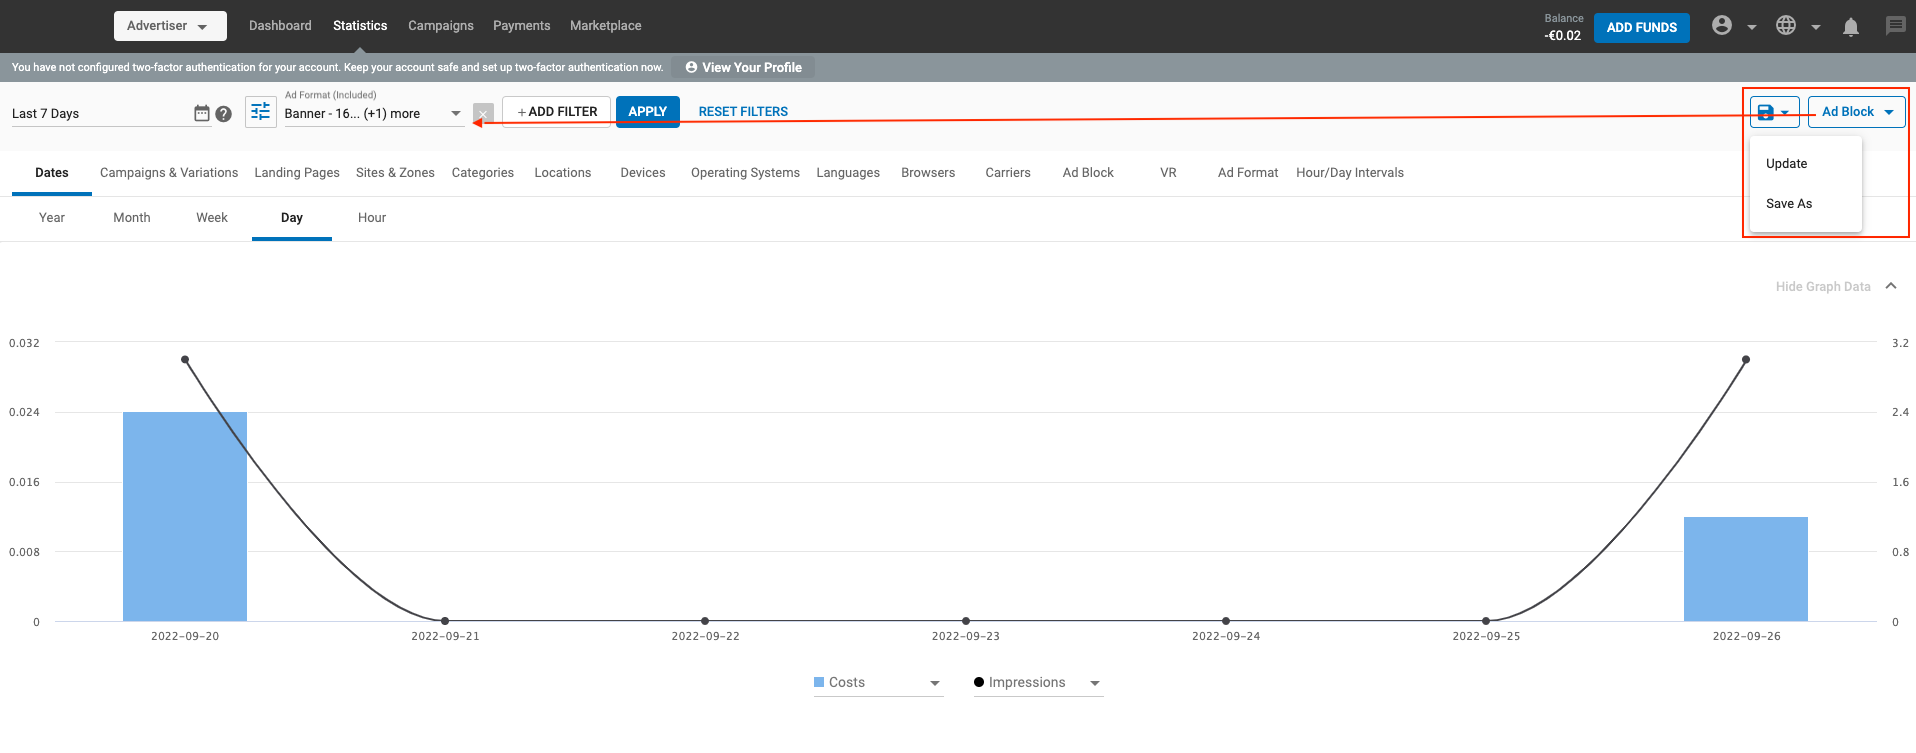
Actualización
- Puede actualizar un informe guardado existente seleccionándolo, cambiando los filtros y haciendo clic en el botón Actualizar.
- La configuración del filtro se actualizará y se guardará en el Informe guardado elegido.
Save As
- También puede guardar un conjunto de filtros existente con otro nombre haciendo clic en la opción Guardar como.
- También puede Guardar como un nuevo informe añadiendo o eliminando algunos filtros de este conjunto.
Renombrar, borrar un informe guardado
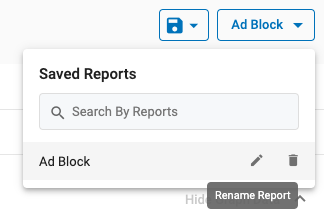
Utilizando los botones de acción de cada informe guardado en el menú desplegable Informe guardado, puede editar o eliminar un informe.
- El icono del lápiz ayuda a cambiar el nombre de un informe guardado. Tenga en cuenta que no puede haber dos informes con el mismo nombre.
- El icono de papelera ayuda a eliminar un informe guardado. Tenga en cuenta que una vez borrado un informe, no podrá deshacer esta acción.
El panel de datos gráficos
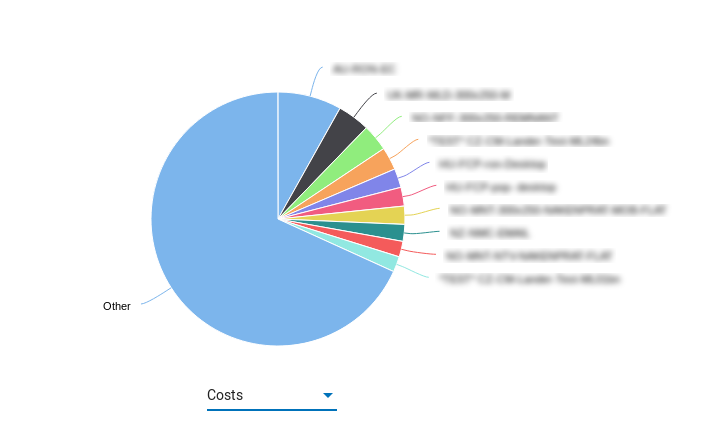
En cualquiera de las pestañas de Estadísticas, puede elegir qué información desea ver en los gráficos de la mitad superior de la pantalla:
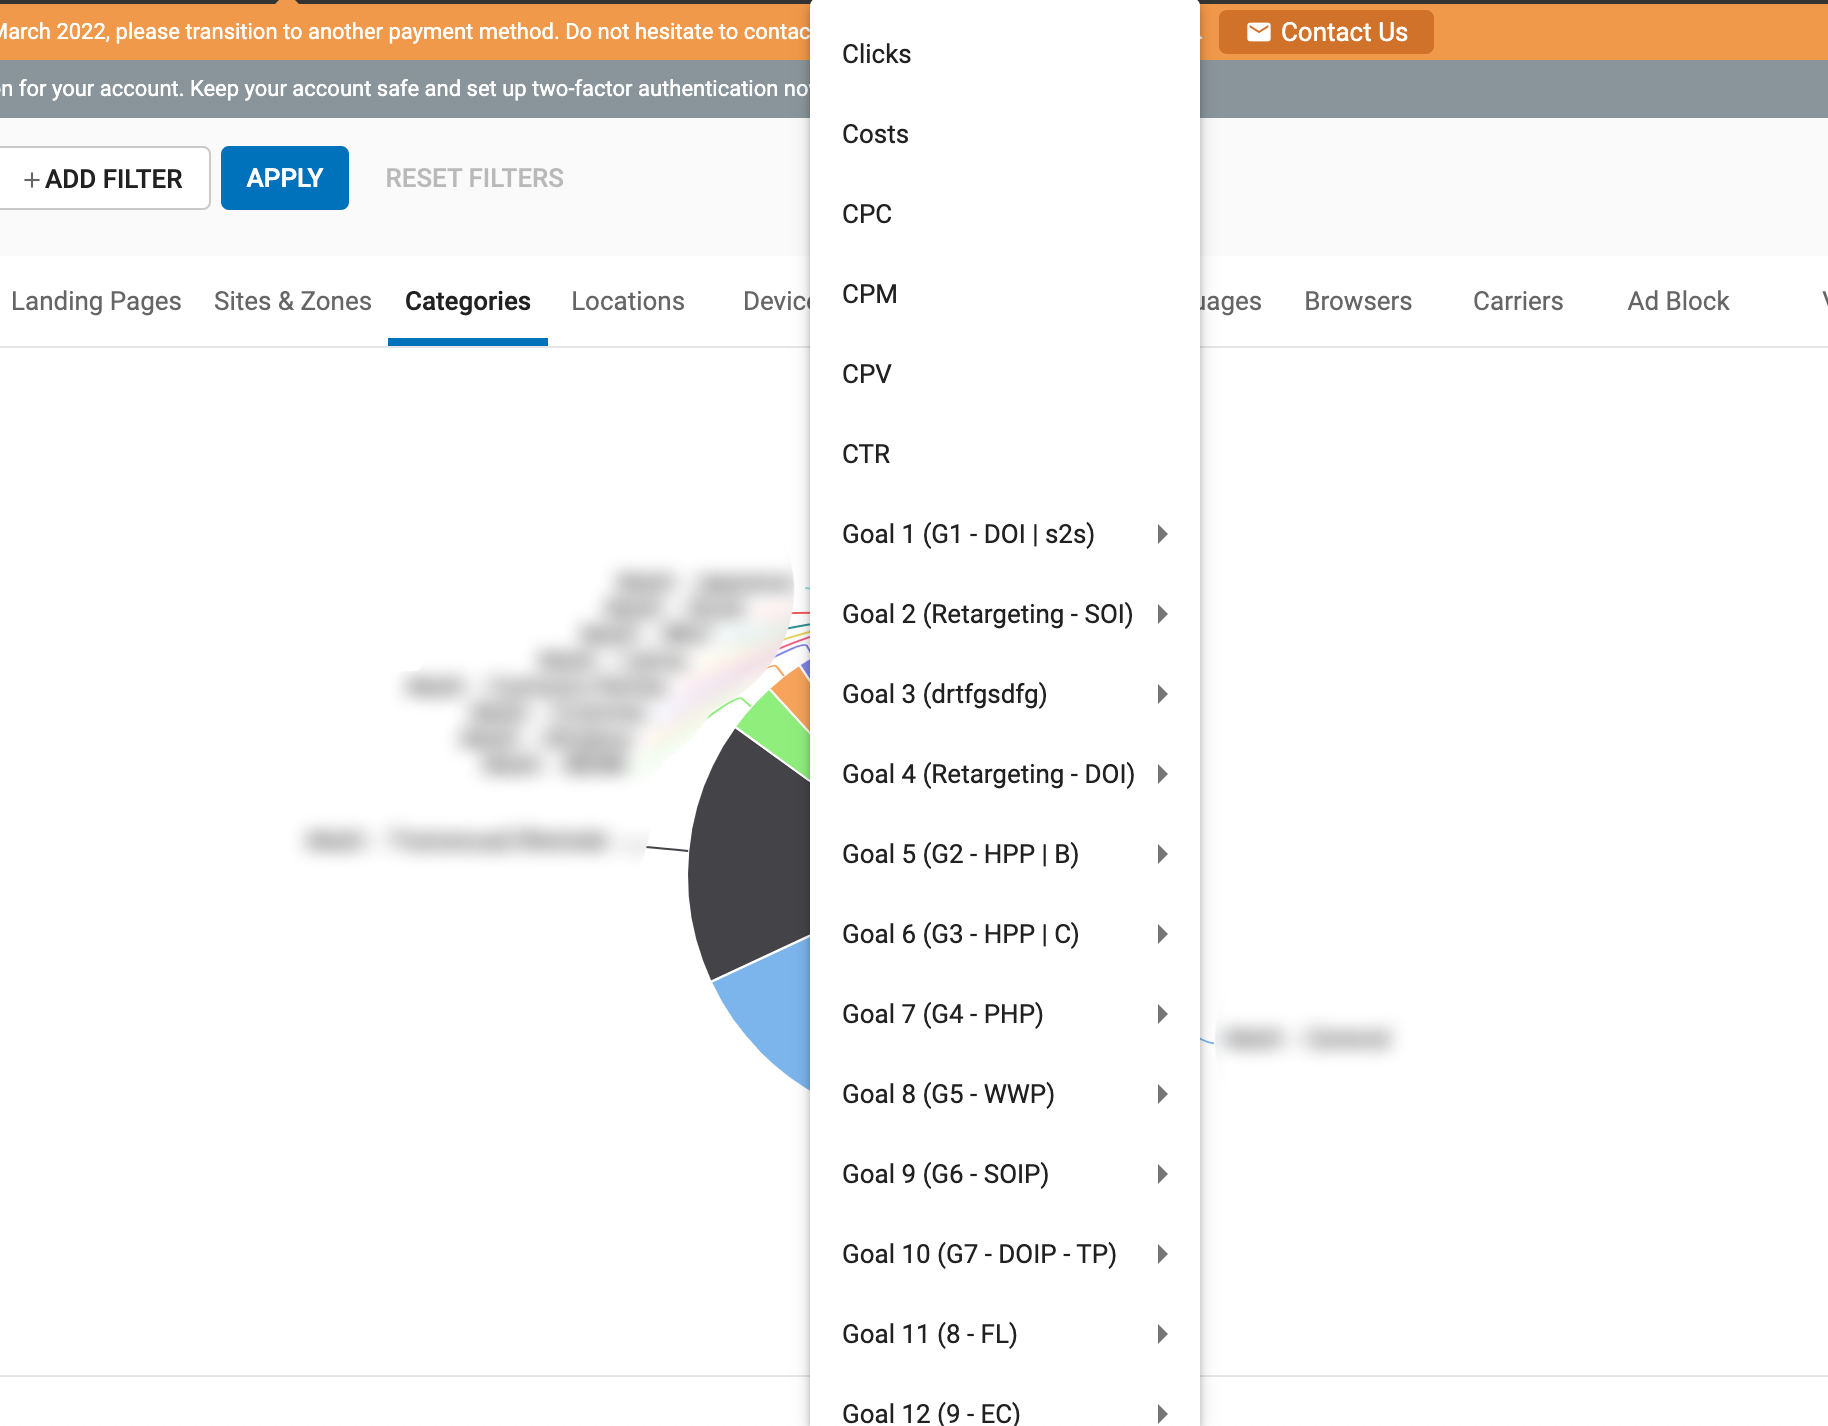
Todas las pestañas de la pestaña Estadísticas le permiten ver gráficos de Costes, CPC, Clics, Impresiones, Impresiones de Vídeo, Vistas, Ratio de Vistas, CPV, CPM, CTR y Conversiones. El tipo de gráfico variará en función de la pestaña:
- En la pestaña Fechas y en la pestaña Intervalos hora/día, puede ver dos de los elementos anteriores presentados en dos gráficos de líneas y barras simultáneos. Para Fechas, puede desglosarlas por Hora, Día, Semana, Mes o Año. Para Intervalos Hora/Día, puede desglosarlos por Día de la Semana y Hora del Día.
- Campañas y variaciones, Páginas de destino, Sitios y zonas, Categorías, Dispositivos, Sistemas operativos, Idiomas, navegadores, portadores, Adblock, VR y Formato de anuncio mostrará un único gráfico circular con un menú desplegable para seleccionar la métrica que desee.
- Localizaciones le mostrará un mapamundi en el que podrá ver sus datos desglosados por países. Puedes ampliar y reducir el mapa con los botones + y - de la izquierda.
La mayoría de las pestañas se dividen en subpestañas. Si hace clic en los elementos del panel General, accederá a la subpestaña correspondiente. Por ejemplo, si hace clic en una campaña del panel Campañas, accederá a la subpestaña Variaciones, que muestra las variaciones de esa campaña.
El panel de datos de la tabla

El panel Datos de tabla muestra los datos del gráfico en formato tabular. En el menú desplegable Mostrar X entradas de la parte superior derecha del panel Datos de tabla, puede elegir cuántas líneas de datos desea ver en la tabla. También puede hacer clic en las flechas situadas junto a cualquiera de los encabezados de columna y ordenar los datos de menor a mayor valor.
Por defecto, el panel Table Data sólo contiene el panel General. Sin embargo, puede añadir los paneles Vídeo, Conversiones y RTB a la derecha del panel General a través de las Opciones de alternancia.
El Panel General
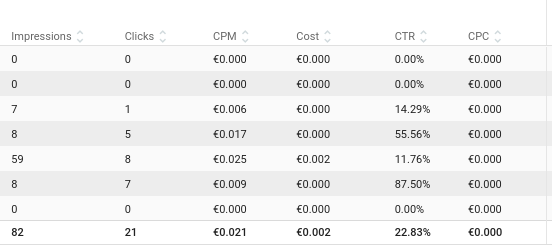
En el panel General verá el elemento del que está viendo los datos en el extremo izquierdo, y a la derecha los datos asociados, incluyendo Impresiones, Clicks, CPM, Costes, CTR y CPC.
El panel de vídeo
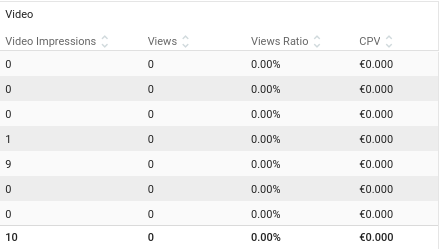
Si el rango de los datos que ha seleccionado incluye tráfico de Vídeo, entonces también verá el Panel de Vídeo, que incluye Impresiones de Vídeo, Vistas Relación de Vistas (que es el porcentaje de vistas basado en las impresiones de vídeo) y el CPV.
Los paneles de seguimiento y objetivos de conversión

Los paneles Seguimiento de conversiones y Conversiones muestran la cantidad de conversiones que generó y varias métricas adicionales que determinan la rentabilidad de sus campañas. Mientras que el panel Seguimiento de conversiones muestra los resultados totales de todos los Objetivos de conversión de tu cuenta, el panel Conversiones muestra las mismas métricas para cada objetivo por separado.
Las métricas que puedes ver en estos dos paneles son las siguientes:
- Cnvs.: muestra la cantidad total de conversiones o las conversiones generadas para ese objetivo específico.
- eCPA (coste efectivo por acción): muestra el precio real que ha pagado para conseguir cada conversión.
- CR (Conversion Rate): número de conversiones dividido por el número de clics.
- CV (Valor de Conversión): valor de la conversión. Esta columna mostrará el valor que asignó al objetivo de conversión durante su configuración (si seleccionó Valor fijo) o dirá Dinámico, en caso de que seleccionara Valor dinámico. Si configuró el objetivo de conversión como Sin valor, esta columna estará vacía. En el panel de seguimiento de conversiones, esta columna devolverá un promedio de todos los valores de conversión de los objetivos que envían esta información.
Las siguientes columnas sólo mostrarán datos si está pasando el valor de la conversión:
- Ingresos: la suma del valor de todas las conversiones generadas.
- Beneficio: los ingresos menos los costes.
- ROI (Retorno de la inversión): su beneficio dividido por el coste.
El beneficio y el ROI pueden aparecer en 3 colores diferentes:
- El número es VERDE: El ROI es superior al 0%. Su retorno de la inversión es positivo y está pagando menos por cada conversión que su COA.
- El número es NEGRO: El ROI es igual a 0%. Su retorno de la inversión es casi OK. Compruebe las estadísticas detalladas de la campaña para mejorar algunas fuentes de tráfico.
- El número es ROJO: El ROI es inferior al 0%. Su retorno de la inversión es negativo y está pagando más por cada conversión de lo que puede permitirse (más que su COA). Compruebe las fuentes de tráfico y la configuración de su campaña en busca de errores.
Cada columna de los paneles Seguimiento de conversiones y Conversiones puede ordenarse de mayor a menor utilizando las flechas situadas en la parte superior de cada columna.
El panel de ofertas en tiempo real

El panel Subastas en tiempo real muestra las estadísticas de varias métricas relacionadas conseguidas a través de las subastas en tiempo real que se producen cuando una página solicita un anuncio.
- Puja media es el importe medio registrado por sus pujas.
- Tiempo medio muestra el tiempo medio transcurrido entre una solicitud y una respuesta.
- Errores muestra el número de solicitudes de oferta que no pasaron el proceso de licitación debido a algún error.
- Ratio de errores muestra el porcentaje de peticiones de oferta con errores frente al número total de consultas.
- Sin oferta muestra el número de solicitudes de oferta a las que no ha respondido.
- No Bid Ratio muestra el porcentaje de solicitudes que no llegaron a la oferta frente al número total de consultas.
- Queries muestra el número de solicitudes de oferta que ha recibido.
- Skipped muestra el número de solicitudes de puja que han sido limitadas automáticamente por el sistema.
- Skipped Ratio muestra el porcentaje de peticiones omitidas respecto al número total de consultas.
- Éxito muestra el número de solicitudes de oferta que han tenido éxito y han recibido una respuesta sin errores.
- Timeouts muestra el número de solicitudes de oferta que han expirado sin respuesta.
- Timeout Ratio muestra el porcentaje de peticiones que han agotado el tiempo de espera frente al número total de consultas.
- Wins muestra el número de solicitudes de puja que han ganado la subasta.
- Ratio de victorias muestra el porcentaje de victorias frente al número total de consultas.
Alternar opciones
Las opciones de alternancia se encuentran en la parte superior derecha del panel Datos de tabla.
- Haciendo clic en el menú desplegable General, puede activar y desactivar las métricas generales en los datos del panel General: Fecha, Impresiones, Clicks, CPM, Costes, CTR, CPC.
- Haciendo clic en el menú desplegable Vídeo, puede activar y desactivar las métricas relacionadas con el vídeo en el panel Vídeo: Impresiones, Vistas, Relación de vistas y CPV. Puede activar/desactivar todas las métricas de vídeo utilizando el botón Vídeo.
- Al hacer clic en el menú desplegable Conversiones, puede activar y desactivar las métricas relacionadas con la conversión en el panel Conversiones: Cnvs, eCPA, CR, CV, Ingresos, Beneficios y ROI. Puede activar/desactivar todas las métricas de conversión utilizando el botón Conversiones y puede activar/desactivar todas las columnas de un objetivo de conversión específico haciendo clic en el cuadrado blanco situado junto al nombre de la conversión.
- Haciendo clic en el menú desplegable Oferta en tiempo real, puede activar y desactivar las métricas relacionadas con RTB en el panel Oferta en tiempo real: CPM medio, Tiempo medio, Errores, Relación de errores, Sin oferta, Relación de sin oferta, Consultas, Relación de rep. Ratio, Skipped, RatioSkipped, Success, Timeouts, Timeouts Ratio, Win Ratio, Wins. Puedes activar/desactivar todas las métricas de conversión usando el botón RTB.
Descargar un archivo CSV con sus estadísticas
Puede hacer clic en el botón Descargar CSV, que tiene dos opciones:

- Elija Descargar datos visibles para descargar sólo los datos visibles en la tabla. Esto descargará sólo las columnas que haya elegido ver utilizando los ajustes de alternancia para los paneles General, Vídeo, Conversiones, Oferta en tiempo real.
- Elija Descargar todos los datos para descargar todos los datos disponibles. Esto descargará todo independientemente de lo que haya elegido ver en la tabla.
Copiar datos visibles

También puede copiar los datos de la Tabla de datos para pegarlos en otro lugar, como una hoja de Excel. Encima de Datos de tabla verás la opción Copiar datos visibles. Esto copiará sólo las columnas que usted haya elegido ver usando las opciones de los paneles General, Vídeo, Conversiones, Oferta en Tiempo Real.
Gestión de campañas mediante estadísticas
La página Estadísticas ofrece varios botones de acceso rápido para ayudarle a navegar por el Panel de administración mientras gestiona sus campañas.
Cuando esté en la pestaña Campañas y Variaciones > Campañas, puede acceder a la configuración de campaña de cualquier campaña mostrada en las estadísticas pulsando el botón Editar en la Tabla Datos, junto al nombre de la campaña:
Cuando esté en la pestaña Campañas y Variaciones > Variaciones, puede pausar las variaciones pulsando el botón Pausa del panel Datos de la tabla.
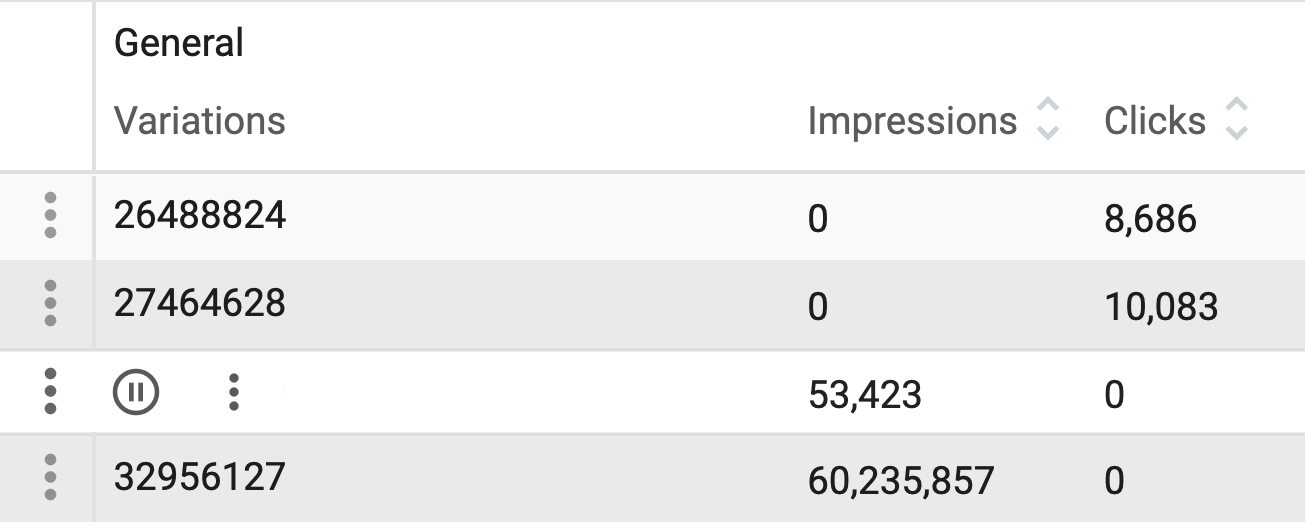
Si está filtrando sus estadísticas por una campaña específica, también puede acceder a la configuración de esa campaña pulsando el botón Editar campaña situado junto a la configuración del filtro:

Por último, cuando esté en la pestaña Sitios y zonas > Zonas y filtre las estadísticas por una campaña específica, puede bloquear zonas y eliminarlas de su campaña pulsando el botón Pausa en el panel Datos de tabla.
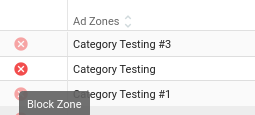
Notas:
- Si pausa la única Variación en ejecución de su campaña, el estado de la campaña cambiará a No se ejecutará ya que no hay Variaciones disponibles para mostrar.
- El bloqueo de zonas a través de las estadísticas puede cambiar el objetivo de zona de su campaña. Si está orientando o bloqueando una zona en su campaña y la desactiva o activa en su campaña, entonces la orientación de la campaña cambiará a Todas.
Actualización de las dimensiones de los objetivos mediante estadísticas
Puede bloquear o desbloquear dimensiones de segmentación para su campaña en la pestaña de estadísticas. Para ello, seleccione una sola campaña utilizando "ADJUNTAR FILTRO". Entonces tendrá acceso a las siguientes dimensiones:
- Sitios
- Ubicaciones
- Dispositivos
- Sistemas operativos
- Idiomas
- Navegadores
- Operadores móviles
Para actualizar una dimensión, vaya a la pestaña correspondiente y busque el icono de bloqueo/desbloqueo.
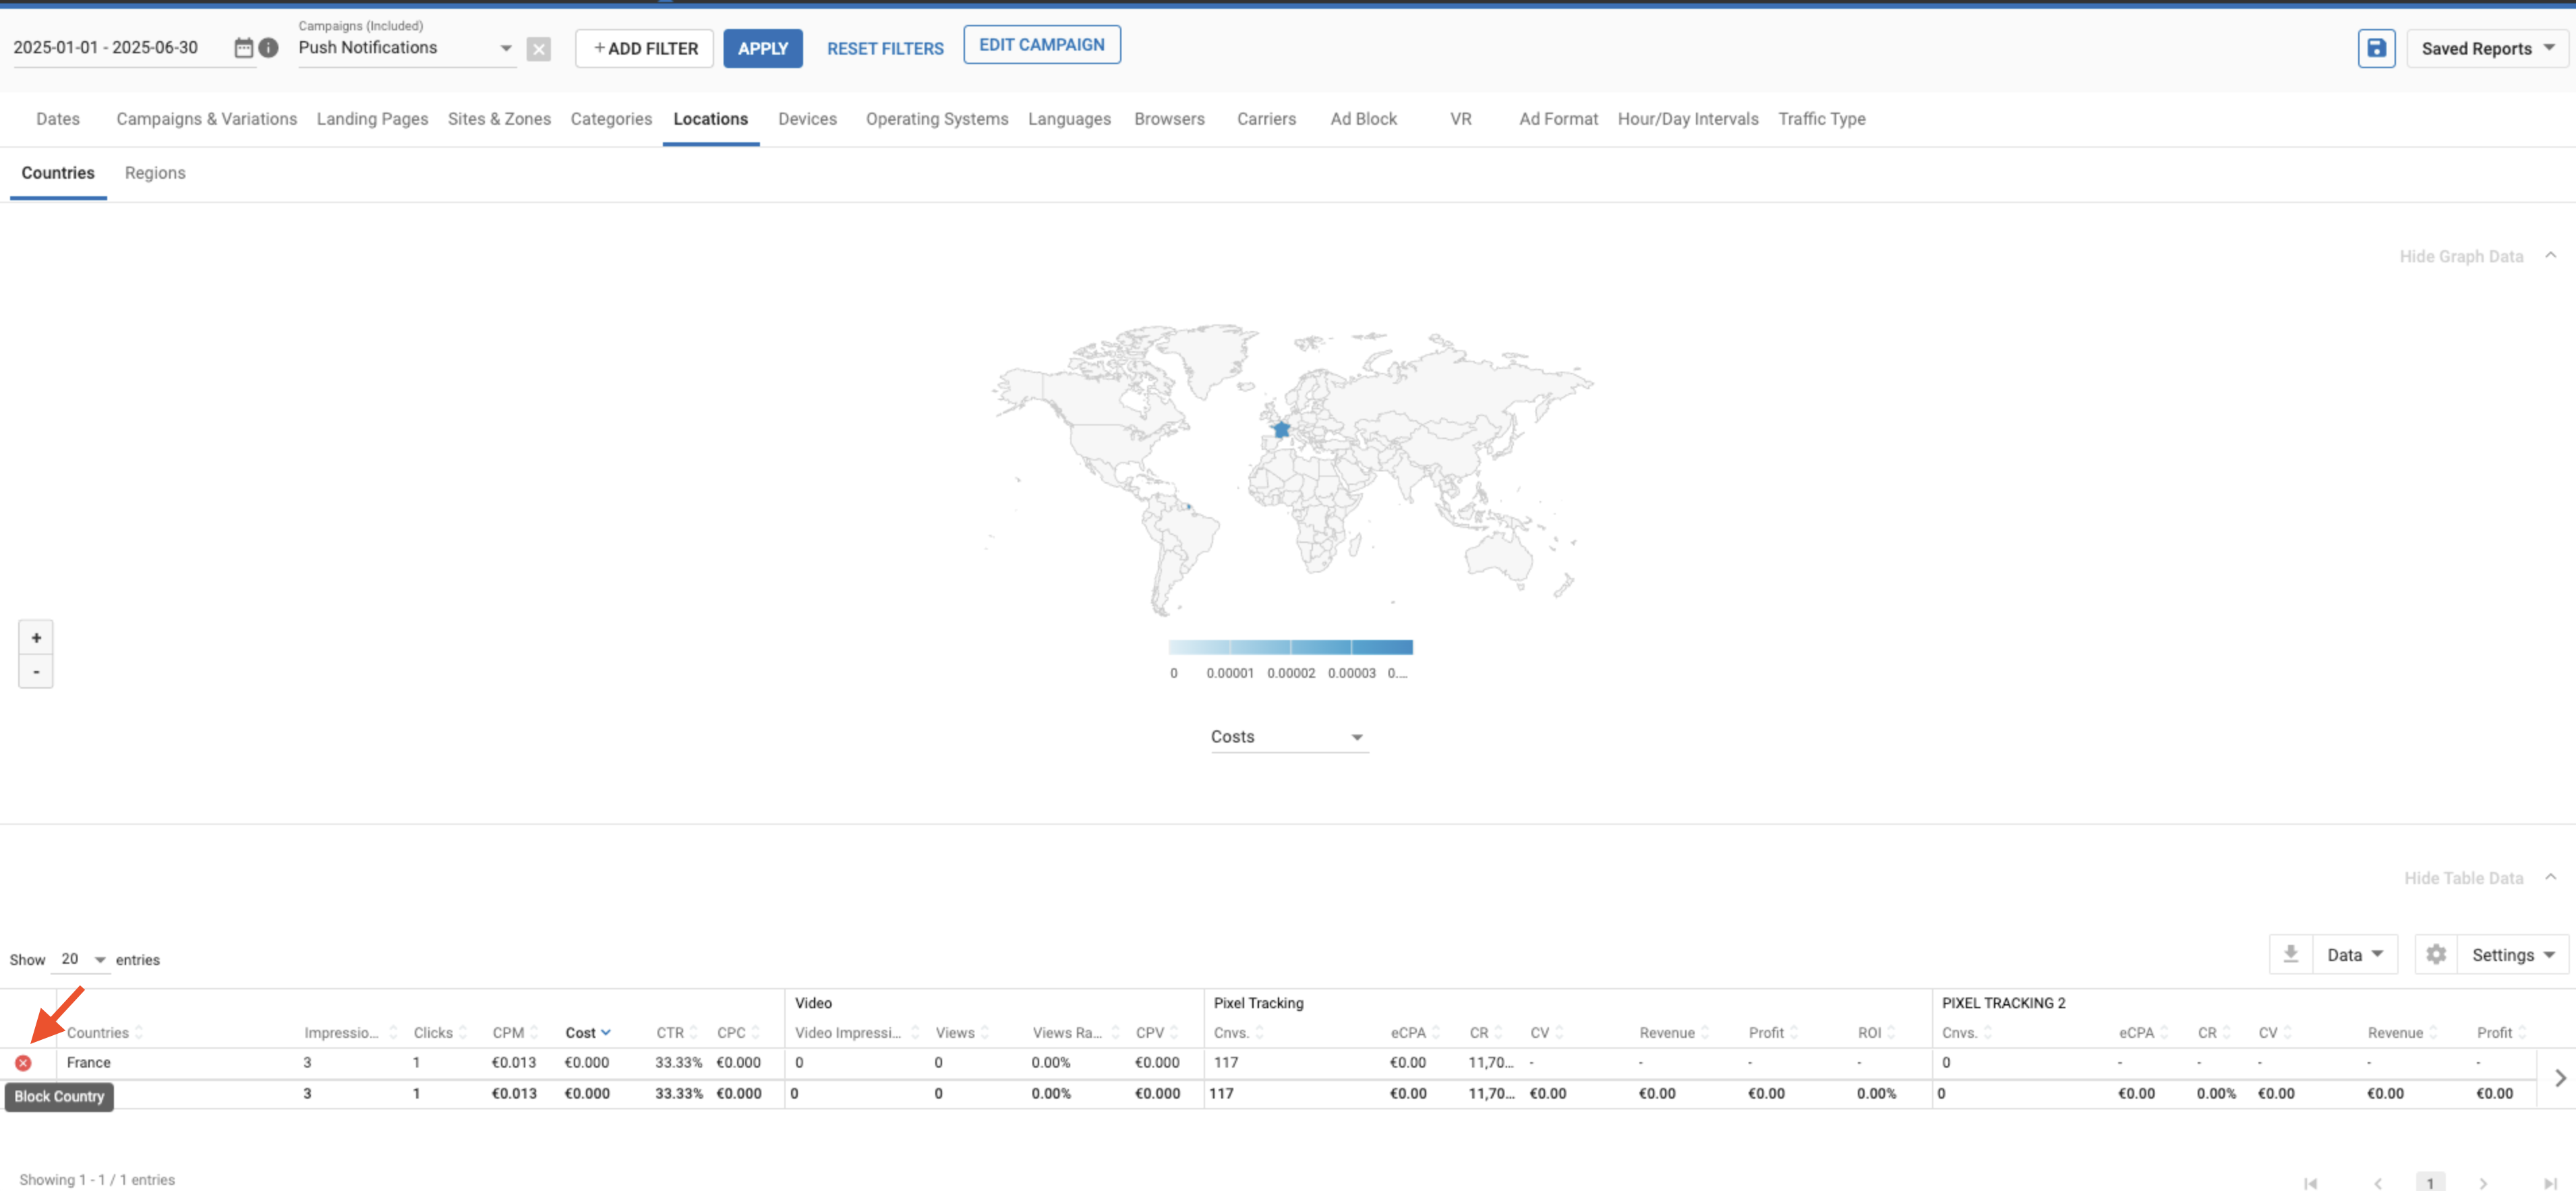
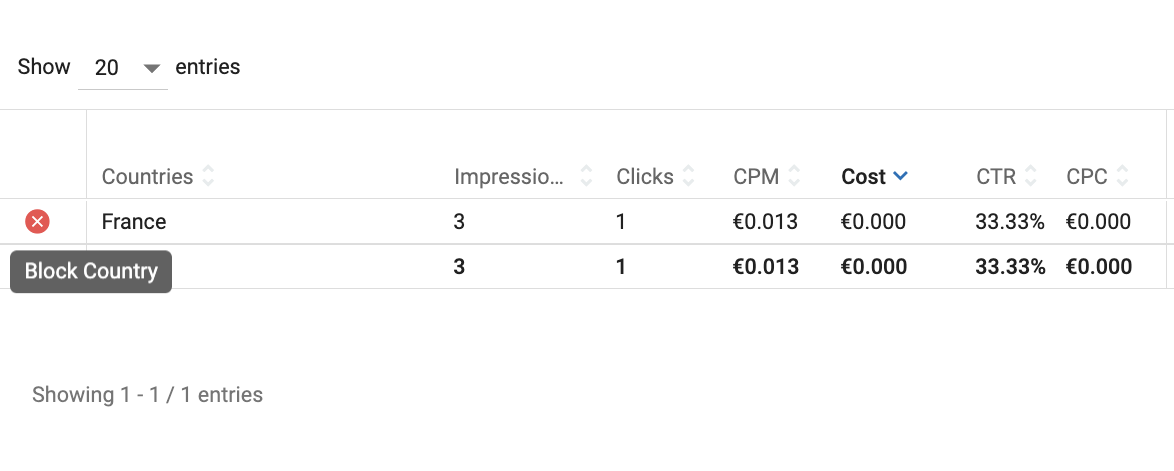
IMPORTANTE: Debe seleccionar una sola campaña utilizando el filtro para gestionar las dimensiones de segmentación. Estas opciones no están disponibles cuando se seleccionan varias campañas.