Painel de controlo
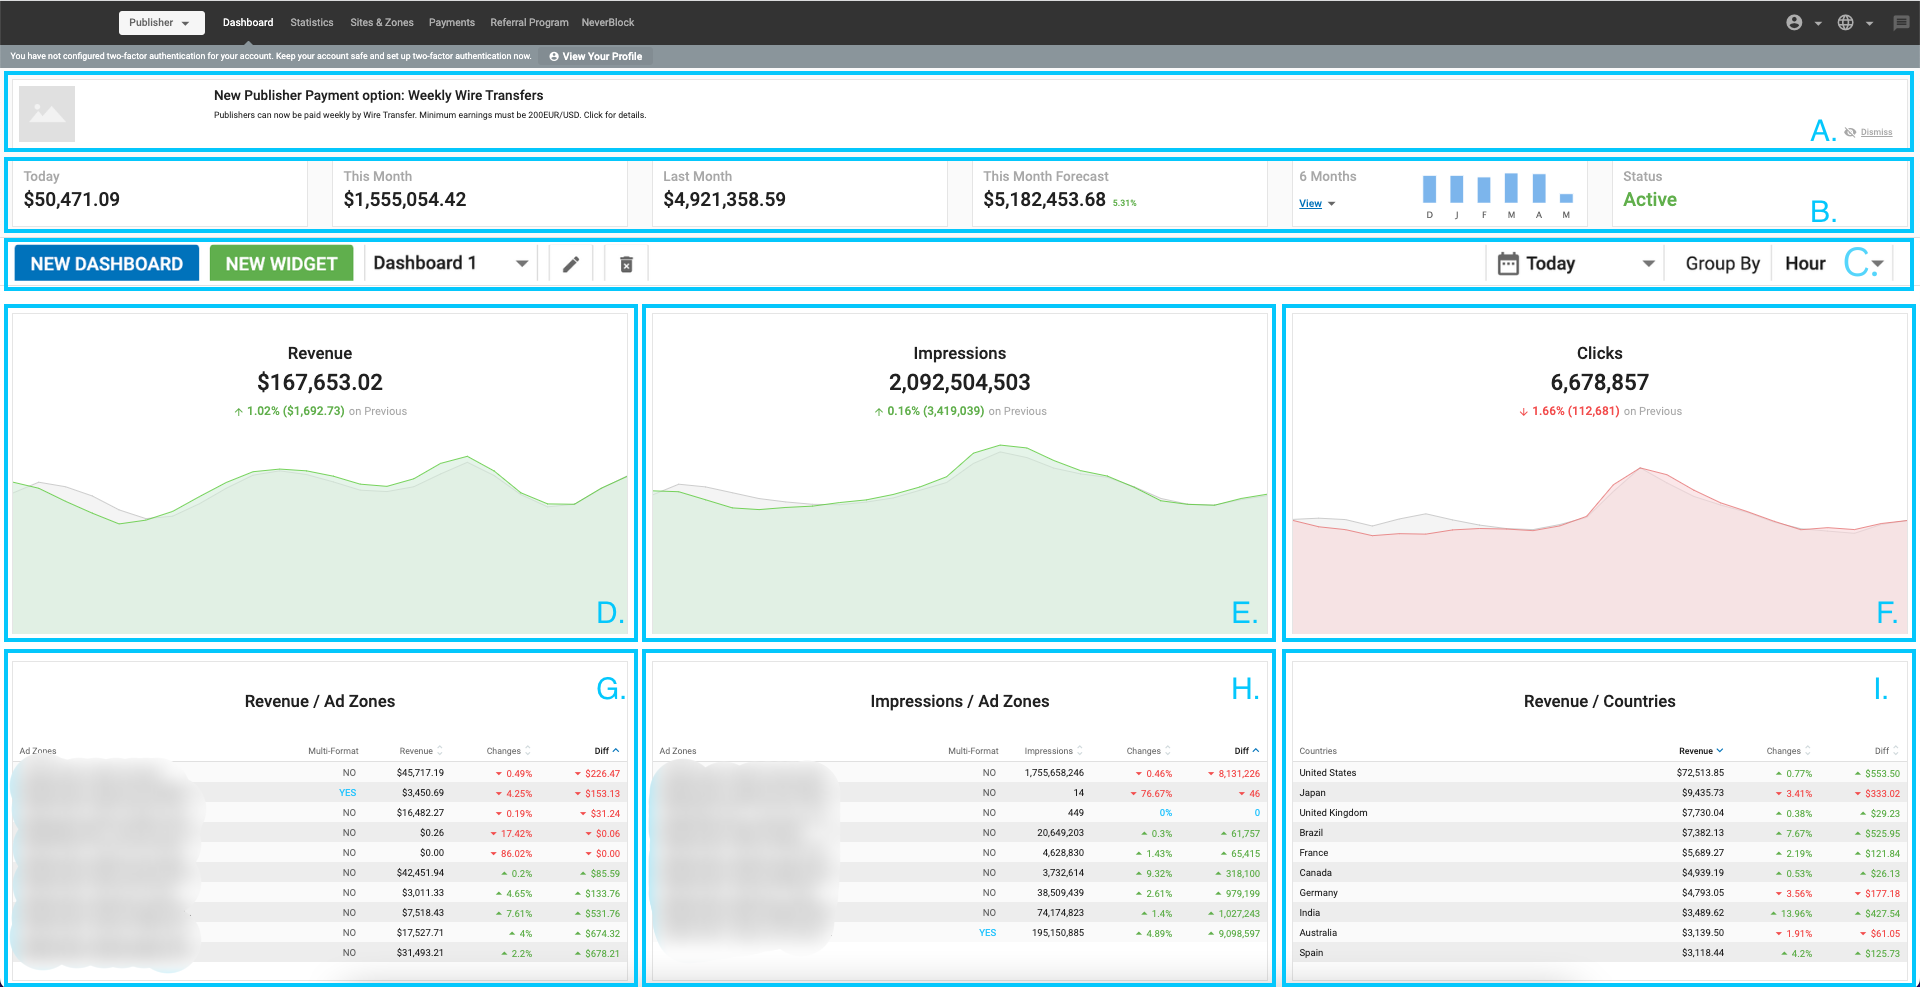
Visão geral do painel de controlo do anunciante
Quando tem sessão iniciada como Anunciante, o Painel de Controlo mostra-lhe informações importantes que lhe dão uma ideia do desempenho das suas campanhas.
Painéis superiores (A) e (B)

No topo do Painel de Controlo do Anunciante pode ver o Painel de Notícias (A), que mostra quaisquer notícias actuais que possam ser do seu interesse. Pode ignorar ou ocultar as notícias clicando no ícone Demitir à direita do painel (A).
Abaixo, em (B), pode ver o seu Saldo atual a verde e o montante que gastou em campanhas para Hoje, Este mês e os últimos 6 meses. Clique em Ver para ver o gráfico dos últimos 6 meses. O painel Estado mostra-lhe o Estado da sua conta, se está Verificada ou Não verificada para executar campanhas publicitárias.
Nota: Nas secções seguintes, verá descrições dos gráficos e tabelas predefinidos que são apresentados no Painel de controlo. No entanto, pode personalizar o painel de controlo para mostrar quaisquer gráficos e tabelas que satisfaçam as suas necessidades.
Gráficos (C), (D), (E), E (F)
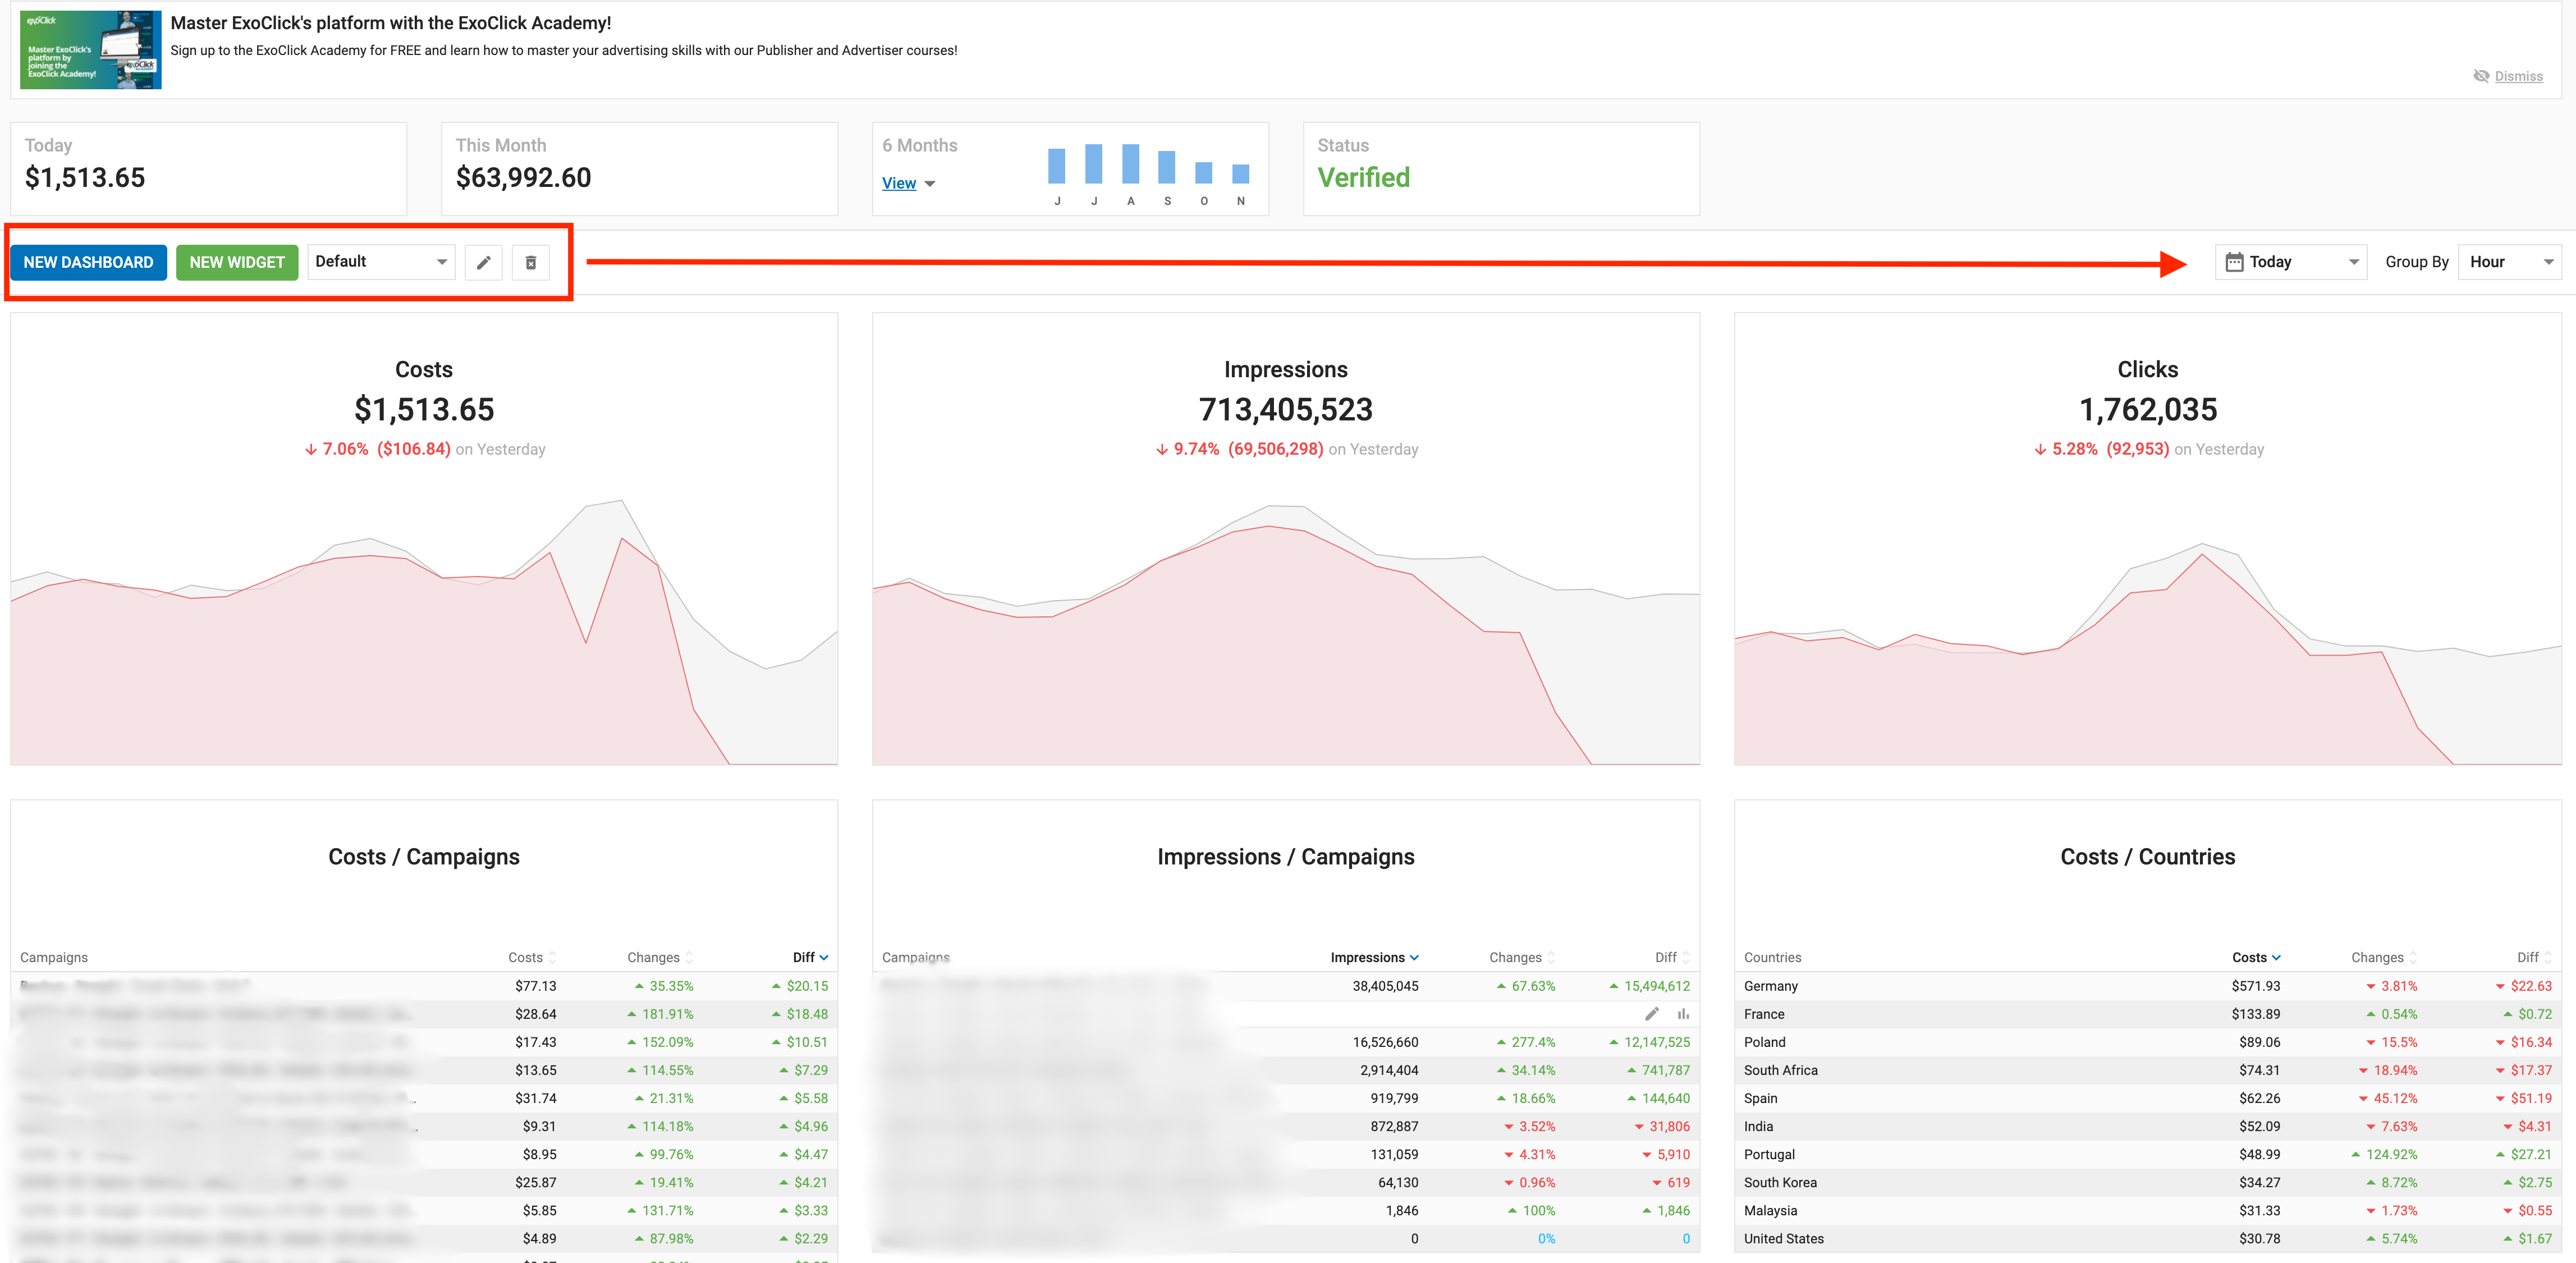
 In (C) you can choose to add new dashboards and customize each dashboard to your needs. Also, you can choose a time option Today, Yesterday, Last 7 Days, Last 30 Days, This Month, or Last Month. You can read more about this section here in this document.

Cada um dos três gráficos em (D), (E) e (F) apresenta duas linhas, para que possa comparar a forma como as coisas mudaram no período de tempo selecionado. A linha vermelha/verde mostra o período posterior e a linha cinzenta mostra o período anterior para comparação.
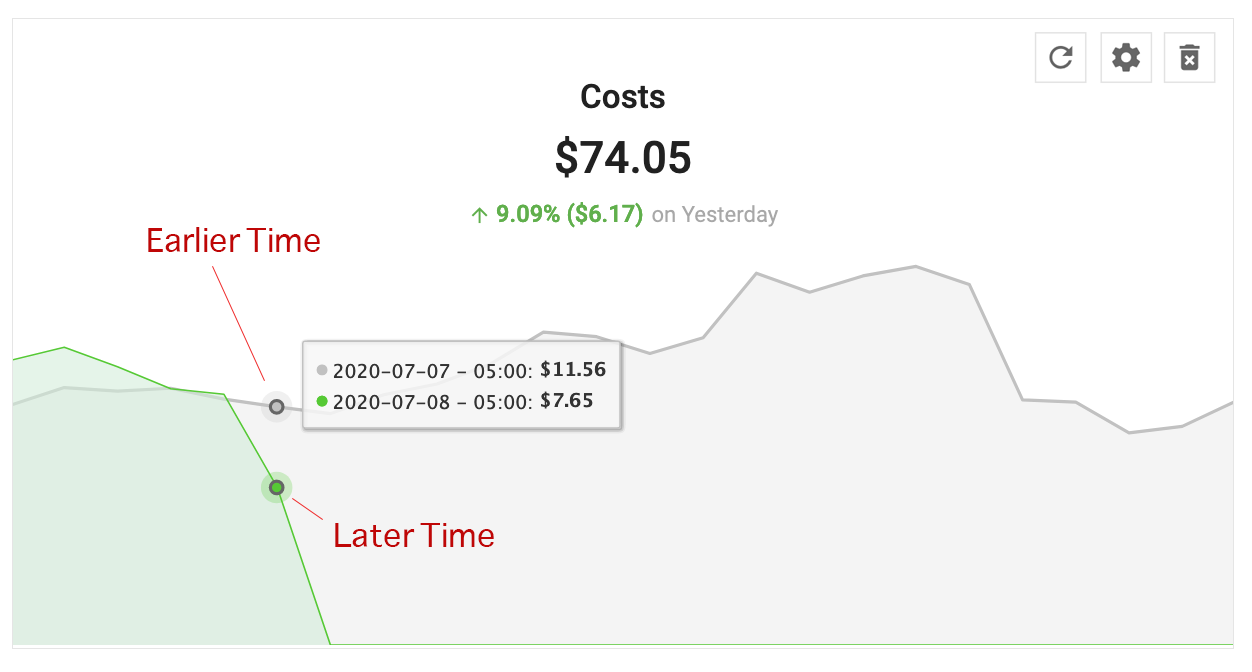
Assim, se tiver escolhido Este mês como período de tempo, qualquer ponto na linha vermelha mostrará uma data deste mês e o ponto cinzento mostrará a data correspondente do mês anterior.
Nota: Quando selecionar Hoje como período de tempo, os dois gráficos de linhas irão comparar os tempos no dia atual com o mesmo tempo no dia anterior.
Quando selecionar Ontem como período de tempo, os dois gráficos de linhas irão comparar os tempos individuais em horas de ontem com os mesmos tempos no dia anterior.
D. Custos: Este gráfico mostra o total que gastou nas suas campanhas no período de tempo selecionado. O gráfico de linhas vermelhas/verdes mostra o total para o período de tempo selecionado, enquanto o gráfico de linhas cinzentas mostra o período anterior.
E. Impressões de vídeo: Este gráfico mostra o total de impressões de vídeo que os seus anúncios receberam. O gráfico de linhas vermelhas/verdes mostra o total para o período de tempo selecionado, enquanto o gráfico de linhas cinzentas mostra o período anterior.
F. Cliques: Este gráfico mostra o total de cliques que os seus anúncios receberam. O gráfico de linhas vermelhas/verdes mostra o total para o período de tempo selecionado, enquanto o gráfico de linhas cinzentas mostra o período anterior.
Quadros (G), (H) e (I)
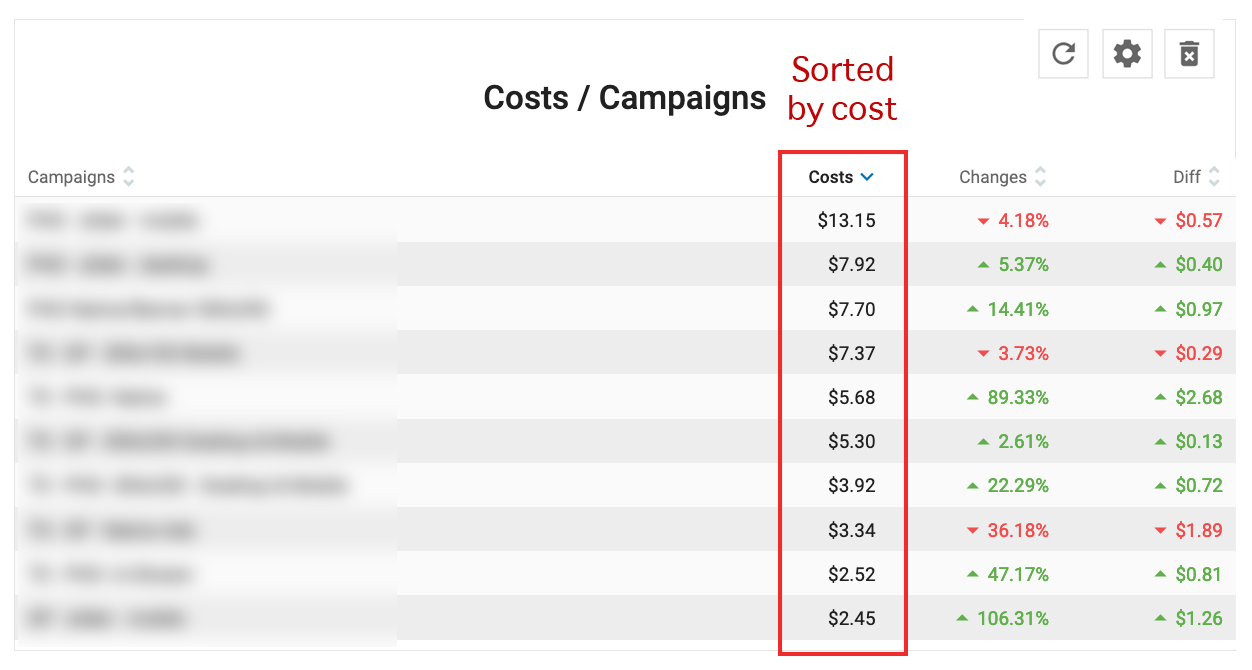
G. Custos / Campanhas: Esta tabela mostra as suas despesas em dez campanhas selecionadas. A escolha das campanhas é determinada pelas colunas Campanha, Custo, Alteração e Diferença: Quando clica num destes cabeçalhos, a lista é ordenada pelo valor mais alto/baixo e as campanhas apresentadas são alteradas em conformidade.
- Custo mostra a quantidade de dinheiro gasto na campanha no período de tempo selecionado.
- Alterações mostra a alteração percentual do custo da campanha no período de tempo selecionado.
- Dif mostra a diferença de custo da campanha no período de tempo selecionado.
H. Custos / Tipos de zona: Esta tabela mostra os seus custos para dez tipos de zonas selecionadas. A escolha dos tipos de zona é determinada pelas colunas Zona, Custo, Alteração e Difusão: Quando clica num destes cabeçalhos, a lista é ordenada pelo valor mais alto/baixo e o tipo de zona apresentado muda em conformidade.
- Custo mostra os custos para o tipo de zona no período de tempo selecionado.
- Alterações mostra a alteração percentual nas impressões da campanha no período de tempo selecionado.
- Dif mostra a diferença de impressões para a campanha no período de tempo selecionado.
I. Custo / Países: Esta tabela mostra as suas despesas em dez campanhas selecionadas. A escolha das campanhas é determinada pelas colunas País, Custo, Alteração e Diferença: Quando clica num destes cabeçalhos, a lista é ordenada pelo valor mais alto/baixo e as campanhas apresentadas são alteradas em conformidade.
- Custo mostra a quantidade de dinheiro gasto na campanha no período de tempo selecionado.
- Alterações mostra a alteração percentual do custo da campanha no período de tempo selecionado.
- Dif mostra a diferença de custo da campanha no período de tempo selecionado.
Ícones de ação nos quadros
![]()
Se passar por cima de qualquer nome de campanha na tabela, aparecerão dois ícones no lado direito da tabela: Editar e Estatísticas.
- Se clicar no ícone Editar, será levado para o Passo 1: Detalhes gerais dessa campanha, para que possa editá-la.
- Clicar no ícone Estatísticas leva-o para o separador Estatísticas, filtrado para essa campanha.
Personalizar o painel de controlo
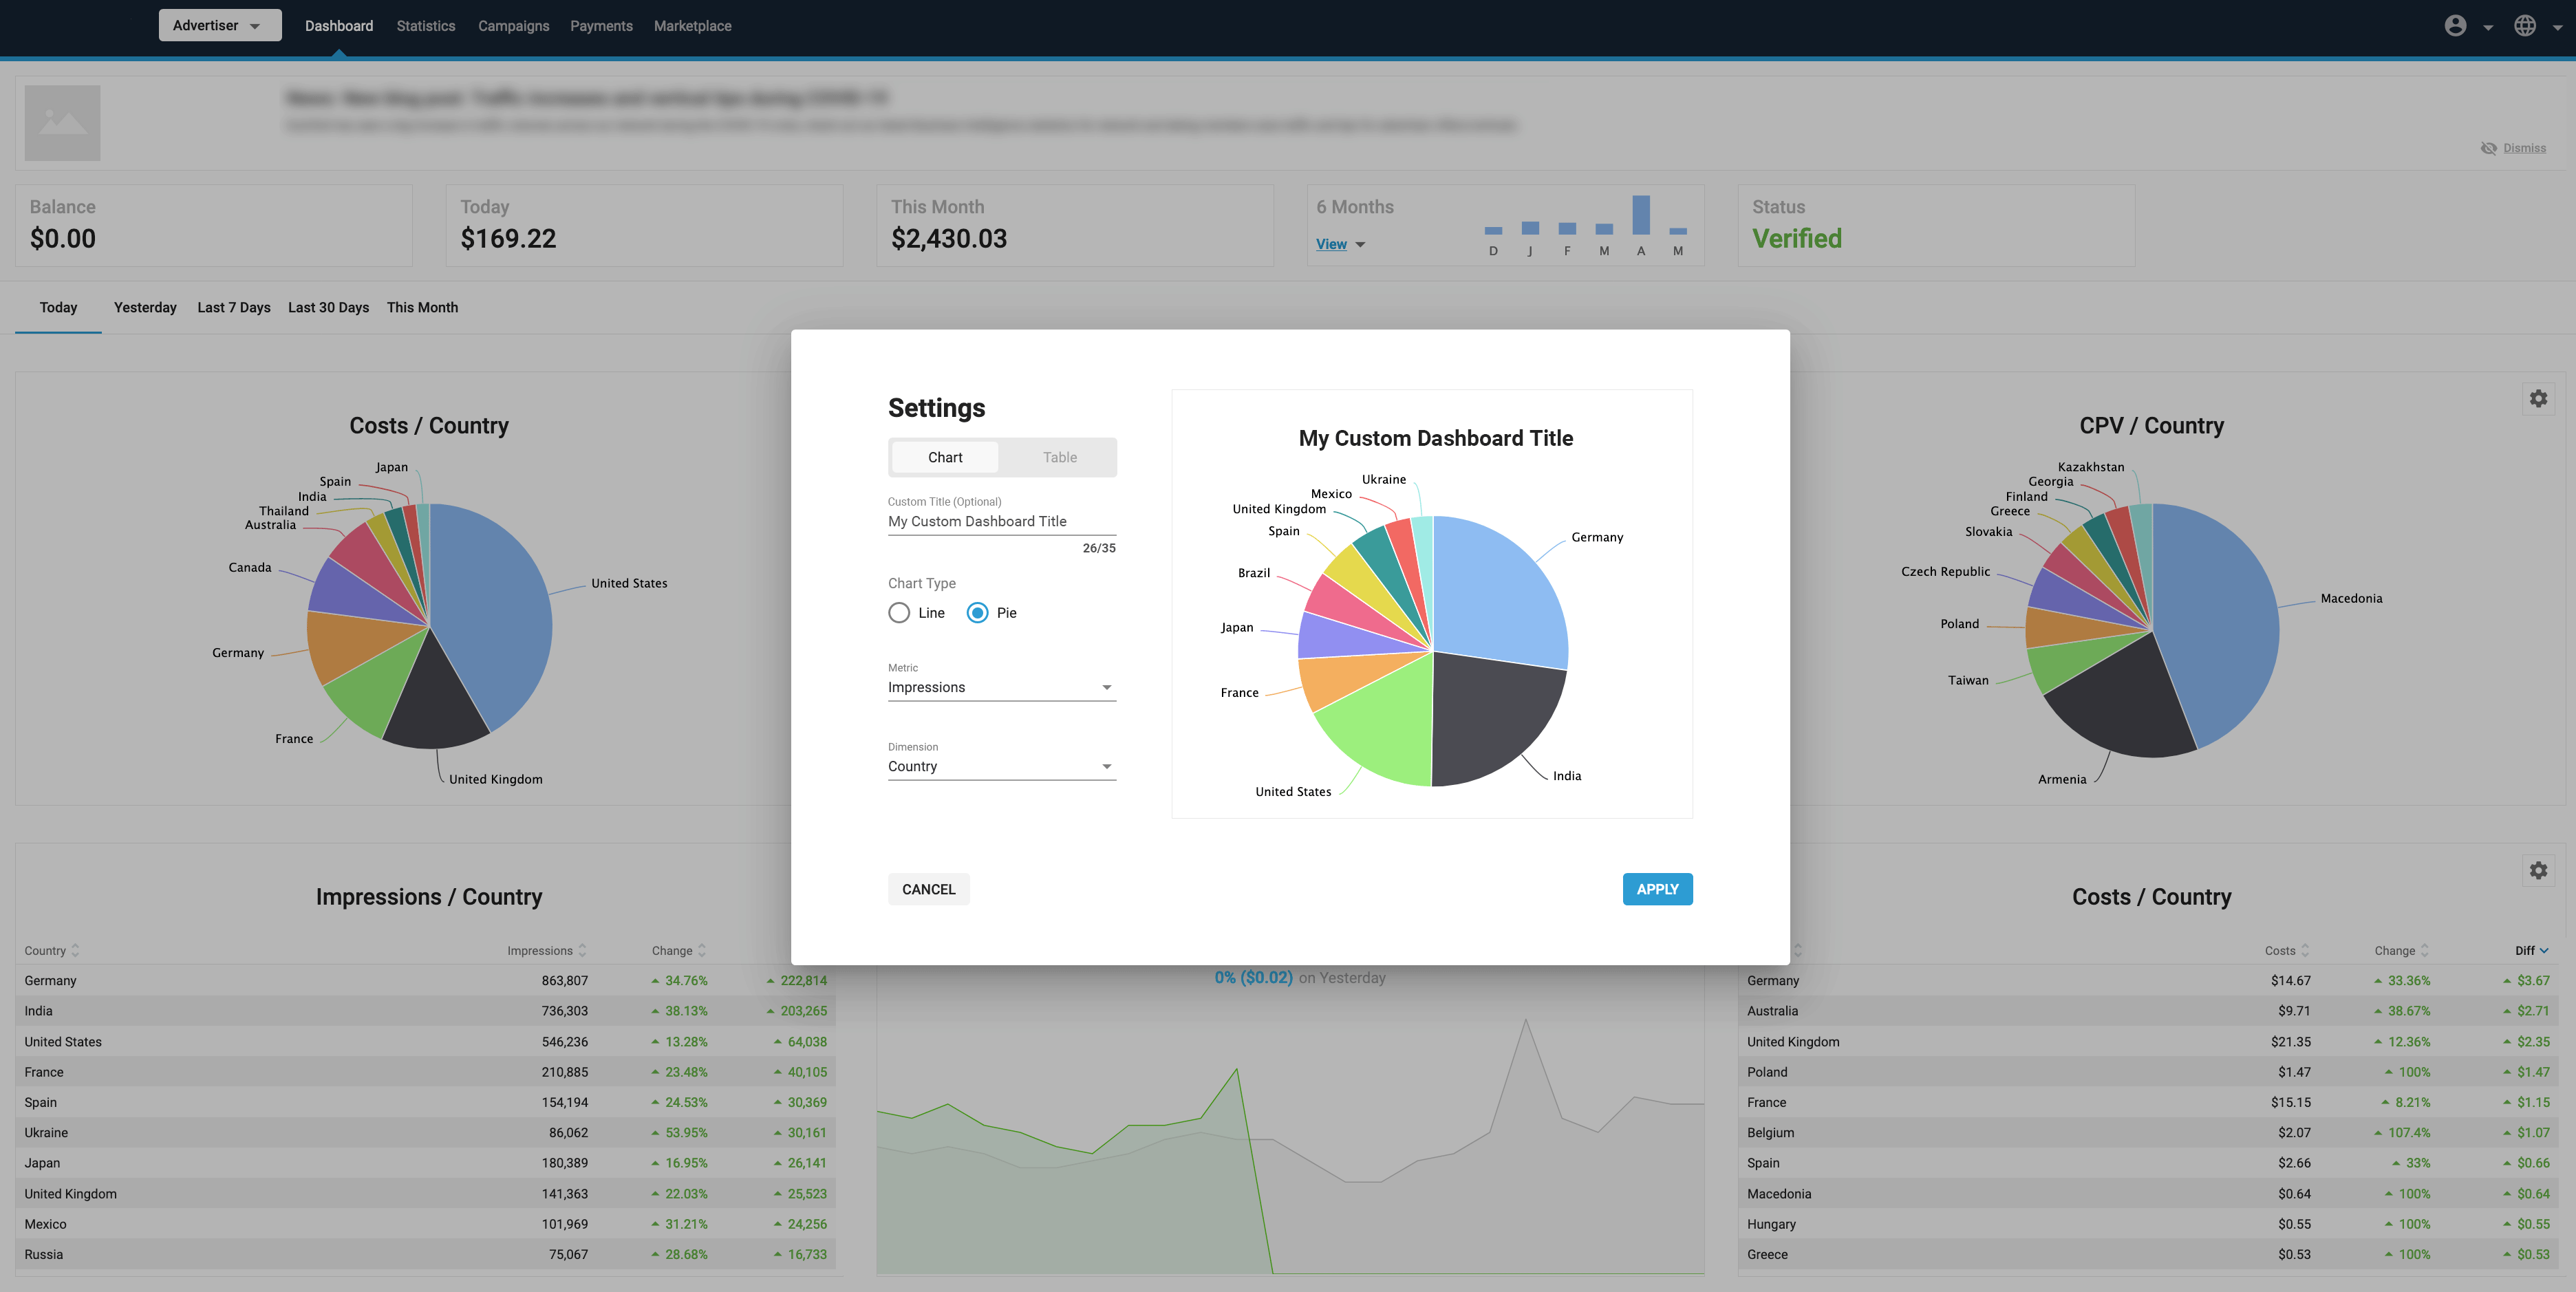
Também é possível personalizar os dados apresentados no seu Dashboard. Pode escolher de entre uma seleção de métricas e dimensões para mostrar nas 9 ranhuras do seu Dashboard. Isto pode ajudá-lo a centrar o seu painel de controlo nos dados específicos mais relevantes para a sua empresa.
No canto superior direito de cada uma das 9 ranhuras, clique no ícone de definições para personalizar os dados apresentados em qualquer um dos painéis. Aparecerá a janela pop-up Configurações do painel. Aqui pode definir as métricas que pretende ver no separador:
Defina se pretende ver um Gráfico ou uma Tabela utilizando os separadores.
Adicionar um título personalizado
O anunciante pode guardar um título personalizado para cada widget de grandes dimensões no painel de controlo. Este campo de título personalizado é opcional. Pode adicionar um título personalizado que melhor se adapte às definições do widget.
Criar um gráfico
Se escolher Gráfico, pode selecionar se pretende mostrar um Gráfico composto, Gráfico de linhas ou Gráfico de tartes:
- Combo: Selecione uma Métrica para mostrar num gráfico de barras, com uma Métrica secundária para mostrar num gráfico de linhas.
- Linha: Selecione uma Métrica para mostrar no gráfico de linhas. Isto mostrará duas linhas, uma para o período de tempo selecionado, por exemplo, dias, e uma linha vermelha/verde para o período de tempo correspondente anterior.
- Pie: Selecione uma Métrica para comparar com uma Dimensão a partir dos menus pendentes.
Depois de selecionar o tipo de gráfico, a métrica e a dimensão, clique em Pré-visualização de atualização para ver o resultado no lado direito da caixa Configurações do painel.
Clique em Aplicar para mostrar este gráfico no seu Painel de Controlo.
Criar uma tabela
Se escolher Table, selecione uma Metric para comparar com uma Dimension na tabela.
Verá uma pré-visualização da sua tabela no lado direito da caixa Configurações do painel.
Clique em Aplicar para mostrar esta tabela no seu Painel de Controlo.
Adicionar e eliminar widgets no seu painel de controlo
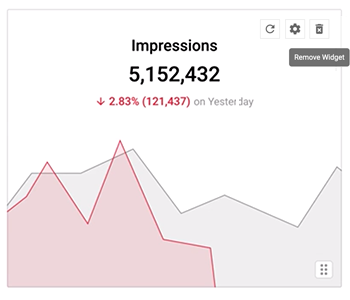
Pode eliminar qualquer um dos seis gráficos/tabelas do seu painel de controlo clicando no ícone de eliminação no canto superior direito de qualquer um deles.
Uma vez eliminado um widget, pode adicionar um completamente novo clicando no botão Novo Widget. Pode então configurar o gráfico/tabela de acordo com as suas necessidades.

Filtrar as suas tabelas ou gráficos
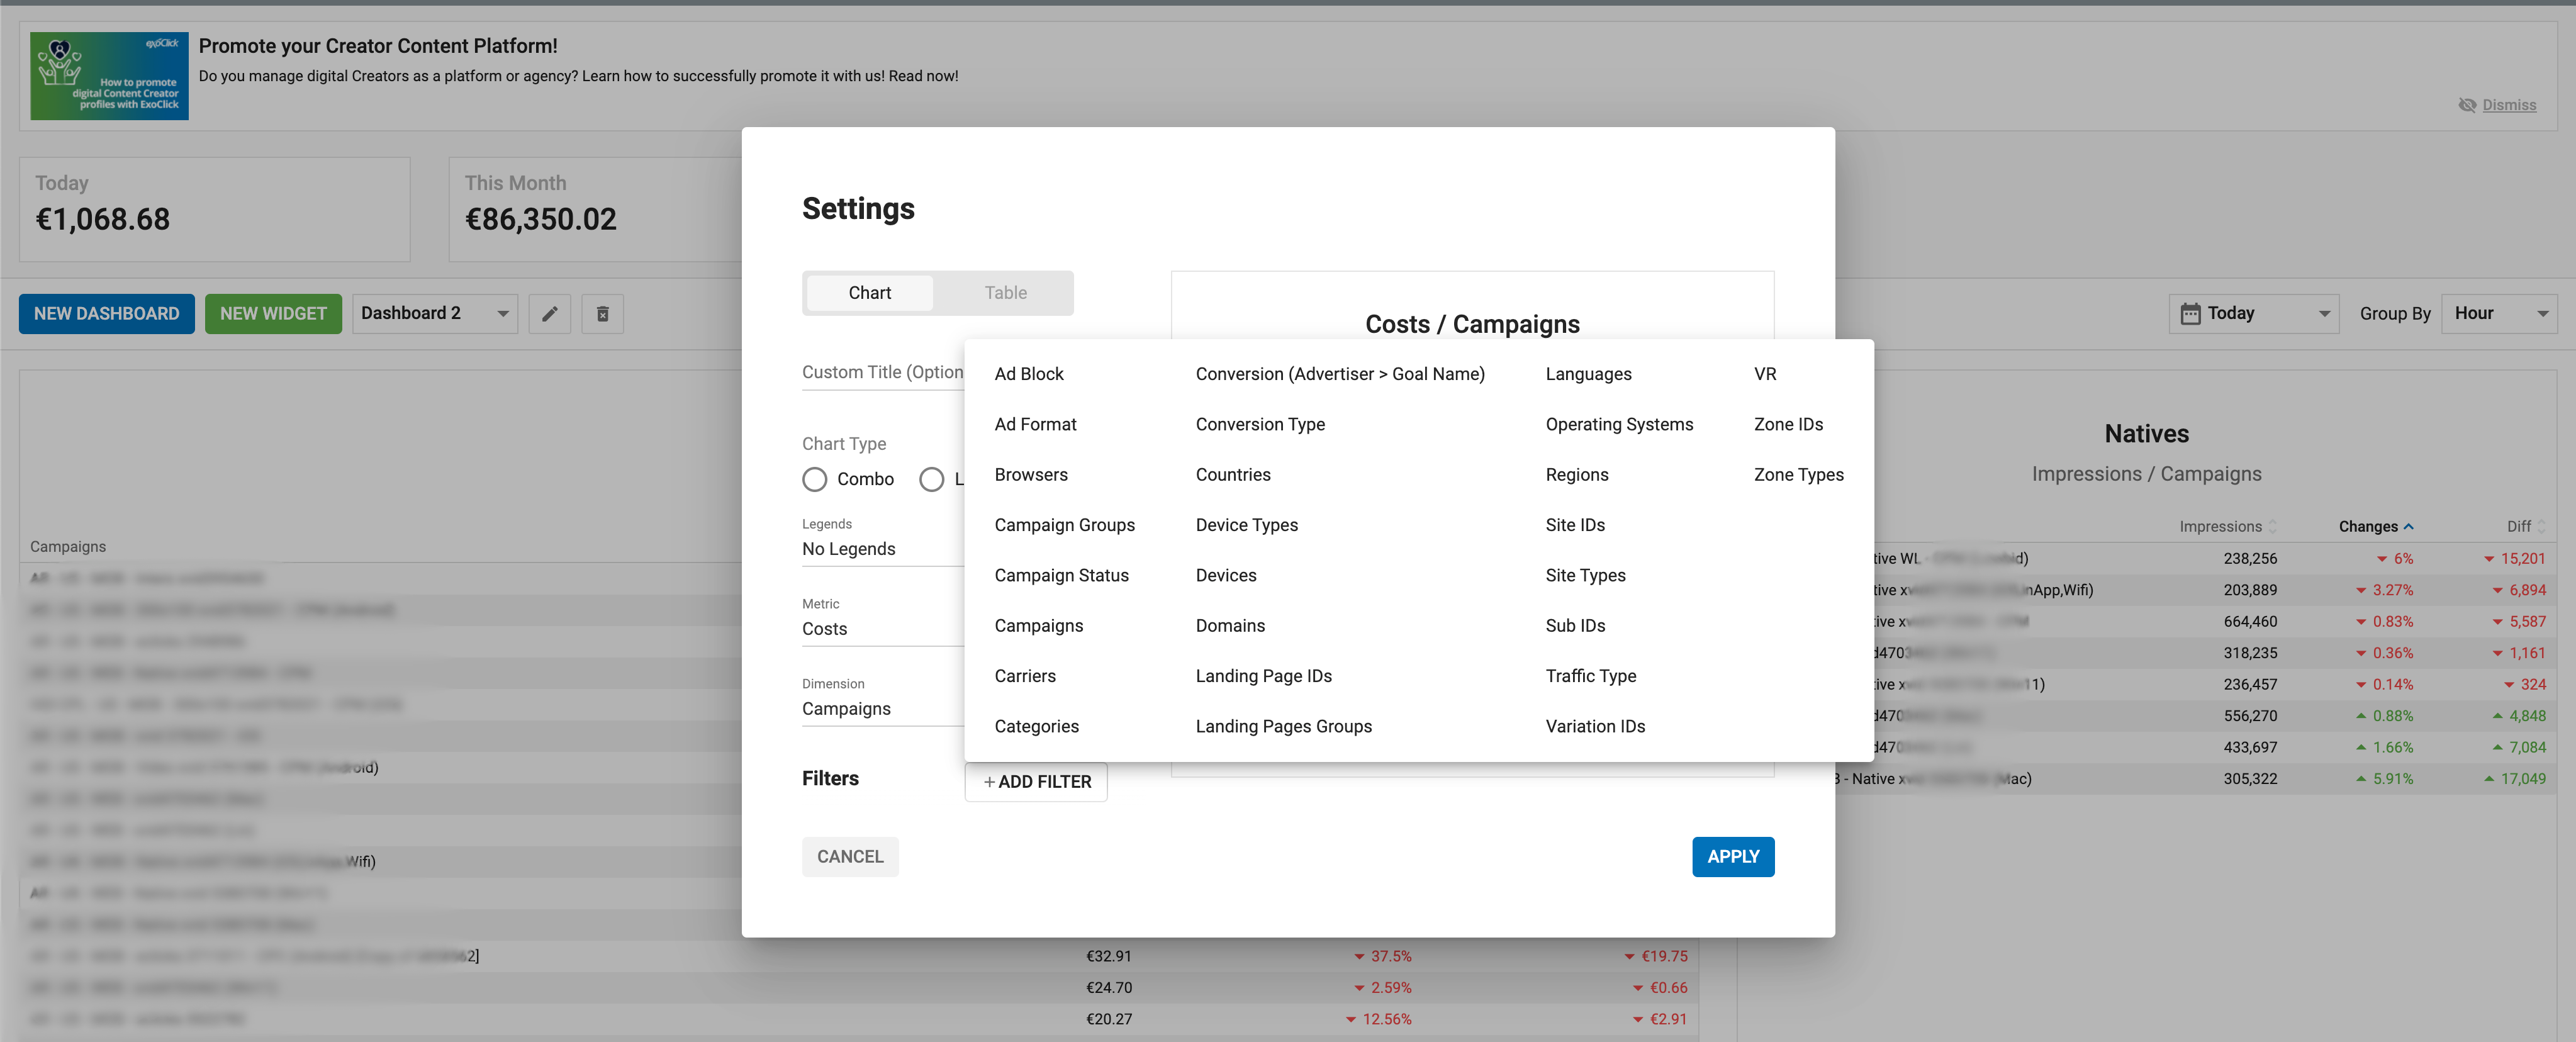
Também pode adicionar um filtro a quaisquer gráficos ou tabelas que crie no seu painel. Por exemplo, pode criar um gráfico Linha que mostre as despesas de hoje e filtrá-lo por Navegadores.
Para tal, clique no botão +Adicionar filtro na parte inferior do painel Configurações do painel e selecione um filtro na lista:
- Quando escolhe um filtro, pode então escolher os itens pelos quais pretende filtrar: Por exemplo, se escolher filtrar por Navegadores, pode utilizar as caixas de verificação para escolher os navegadores a filtrar.
- Utilize a caixa de verificação Mostrar apenas os selecionados para excluir os itens que não foram selecionados e selecione Selecionar tudo para selecionar todos os itens.
- Pode adicionar vários filtros clicando novamente no botão Adicionar filtro.
Depois de ter adicionado os filtros necessários, clique no botão Previsão da atualização no gráfico ou na tabela para ver o seu aspeto.
Quando um widget tiver um filtro aplicado, verá um símbolo Filtro aplicado no lado esquerdo do mesmo:
Filtros disponíveis para anunciantes
- Bloco de anúncios
- Formato de anúncio
- Navegadores
- Grupos de campanha
- Estado da campanha
- Campanhas
- Transportadoras
- Categorias
- Tipo de conversão
- Conversão (Anunciante > Nome do objetivo)
- Países
- Tipos de dispositivos
- Dispositivos
- Domínios
- IDs da página de destino
- Grupos de páginas de destino
- Línguas
- Sistemas operativos
- Regiões
- IDs de sítios
- Sub IDs
- IDs de variação
- VR
- IDs de zona
- Tipos de zonas
Adição de novos painéis
Como anunciante, pode criar vários painéis de controlo personalizados. Desta forma, pode configurar cada um dos seus Dashboards com dados específicos que sejam mais relevantes para o seu negócio. Isto permitir-lhe-á organizar vários Dashboards e ver rapidamente as informações que precisa de saber.
Adicionar novo painel

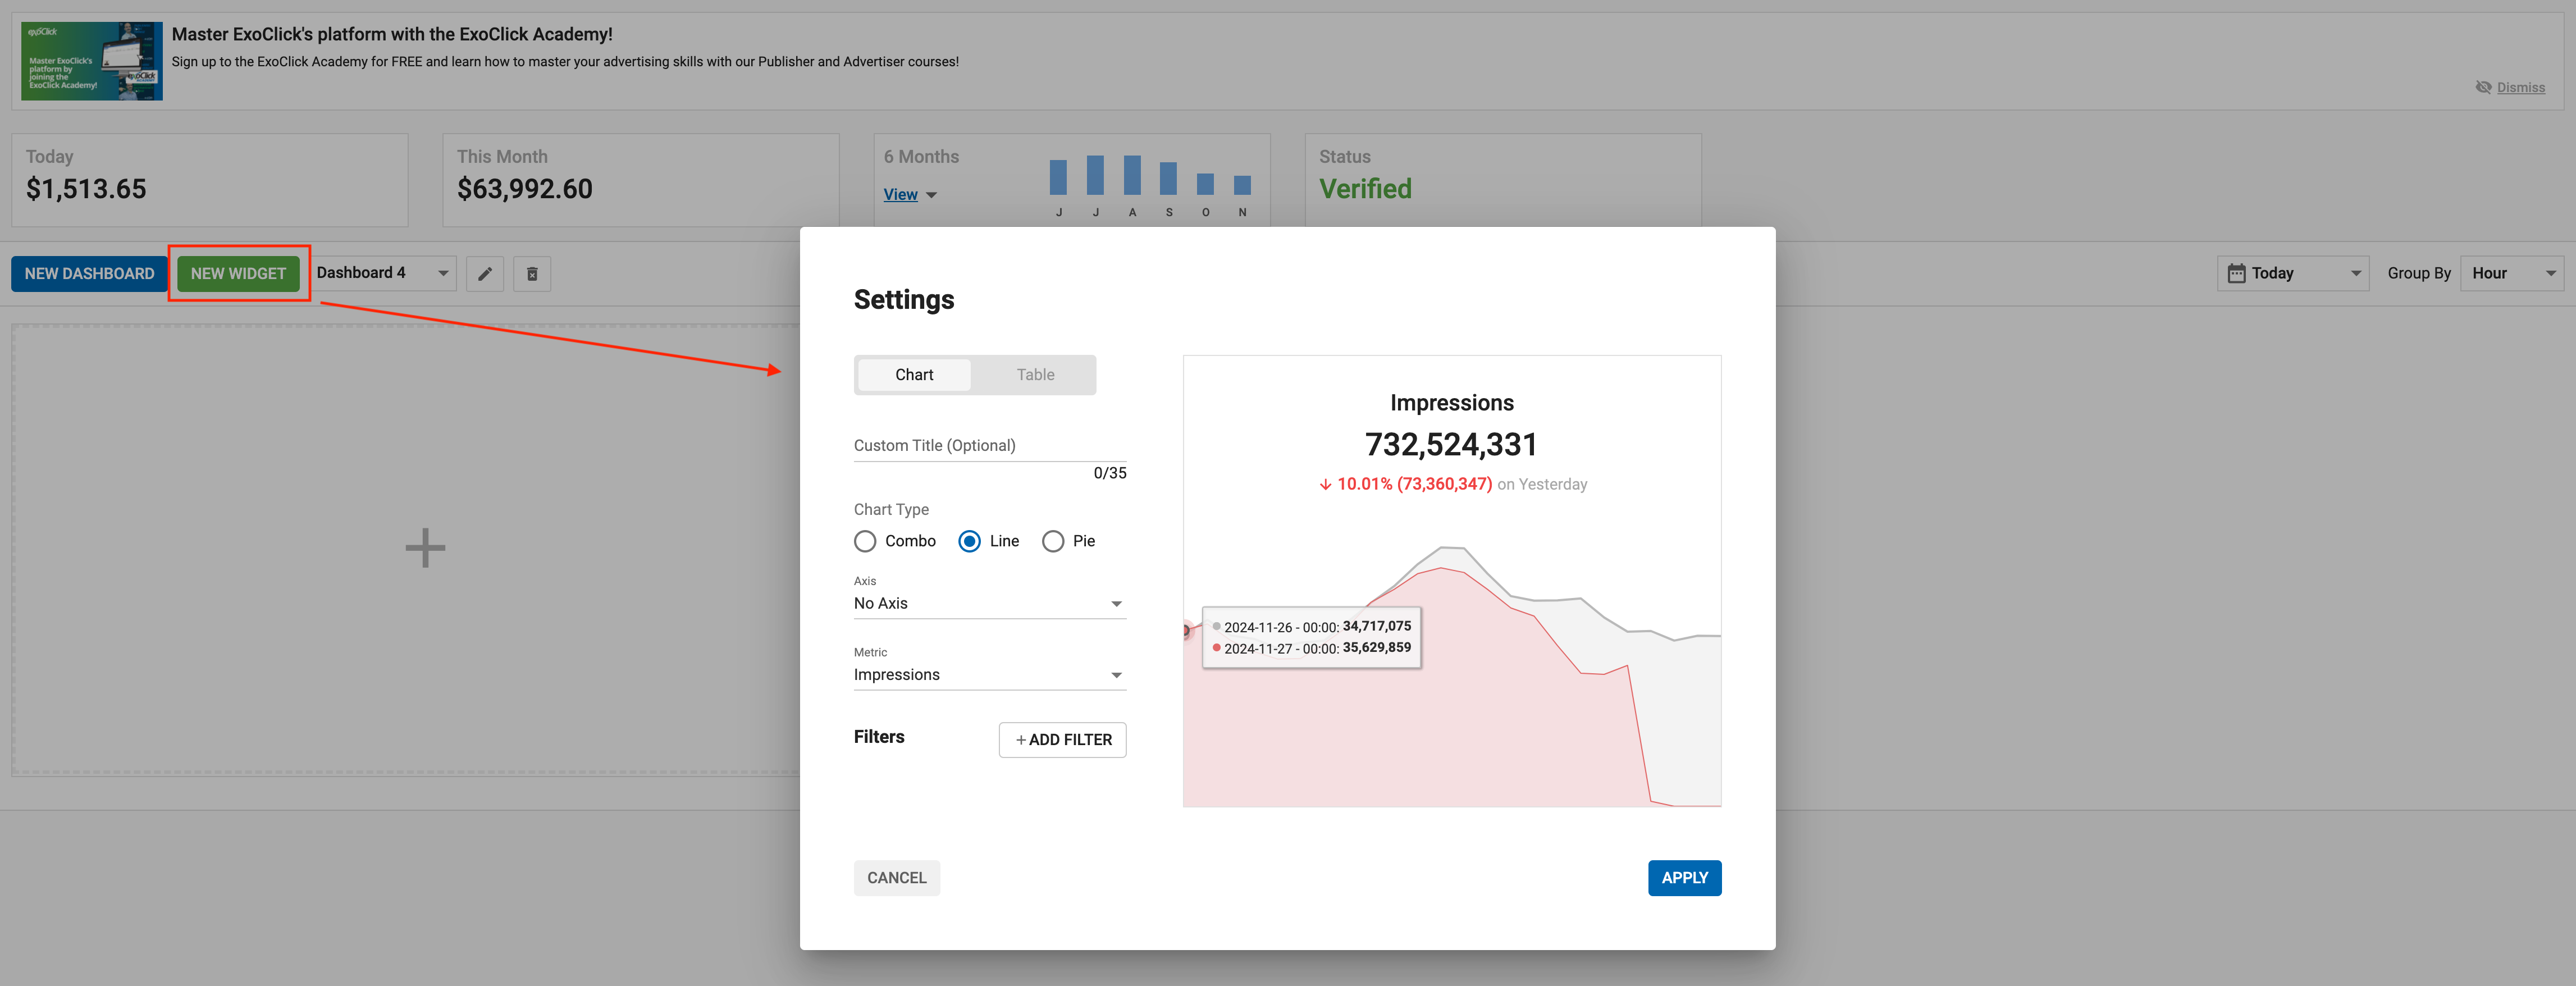
- Clique no botão Novo painel para adicionar um novo painel.
- Clique no botão Novo Widget para adicionar um widget e, em seguida, actualize-o com uma tabela ou gráfico e a métrica que melhor se adequa às suas necessidades.
Mudar o nome de um painel
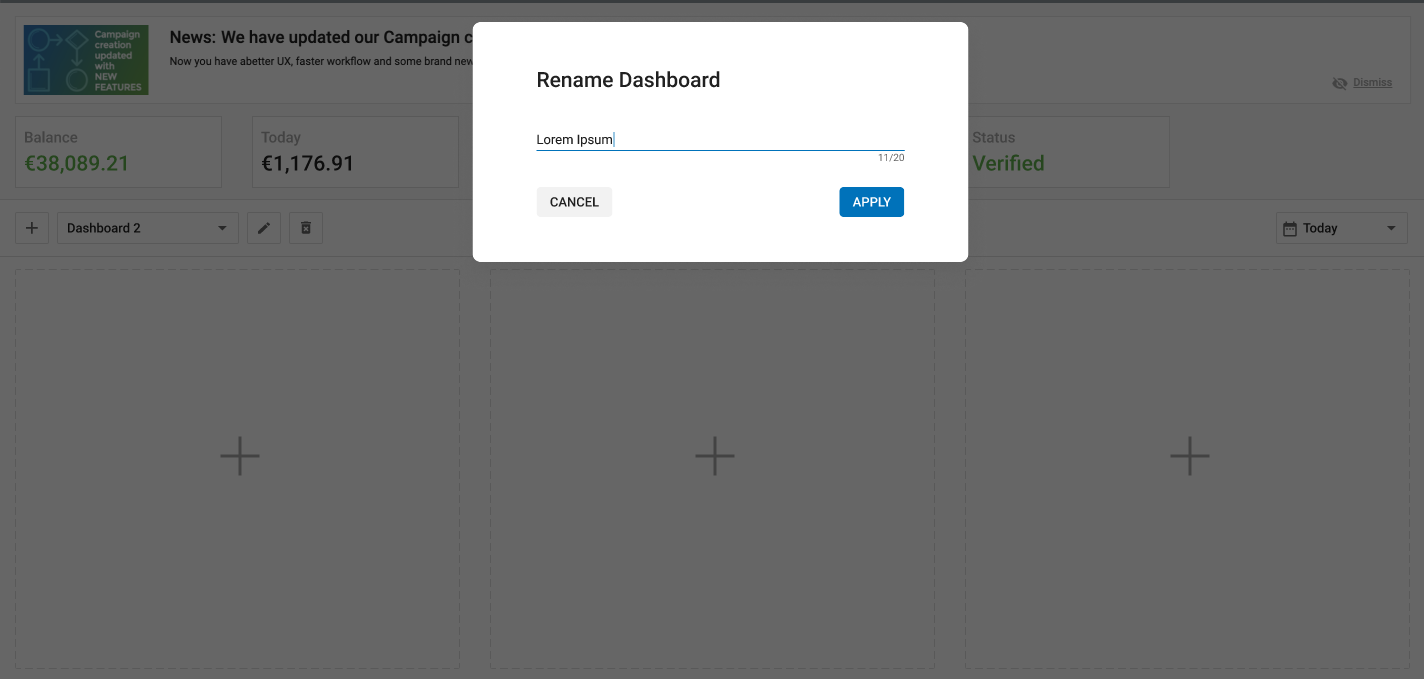
- Clique no ícone Lápis para mudar o nome de um Painel.
- Pode escolher um nome que melhor defina a informação que pretende apresentar nesse Painel.
- Clique no botão APPLY para que este nome seja guardado.
Eliminar um painel de controlo
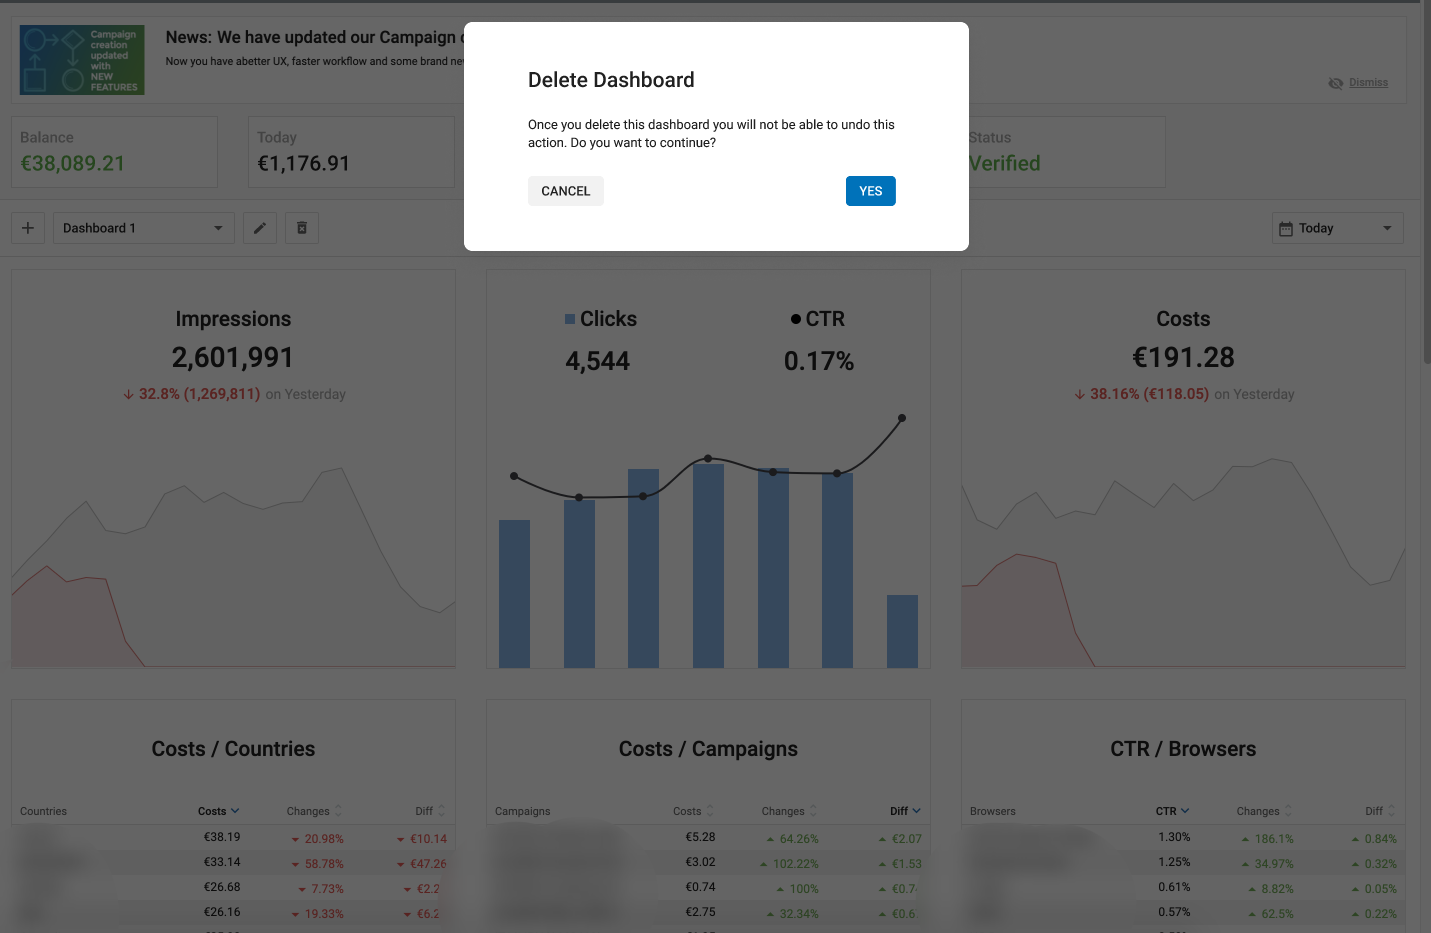
- Clique no ícone Lixo para eliminar um Painel.
- Depois de eliminar um Painel, não será possível anular esta ação.
- Um anunciante pode eliminar todos os painéis de controlo, se necessário.
Arrastar, largar e expandir widgets do Dashboard
Como Anunciante, poderá arrastar, largar ou expandir qualquer widget dentro do Dashboard. Isto permitir-lhe-á alterar facilmente a posição dos widgets e/ou expandi-los, de modo a que os seus dashboards realcem os dados relevantes da melhor forma possível.
Expandir widgets do painel de controlo
- Os quatro cantos são realçados com ícones de expansão.
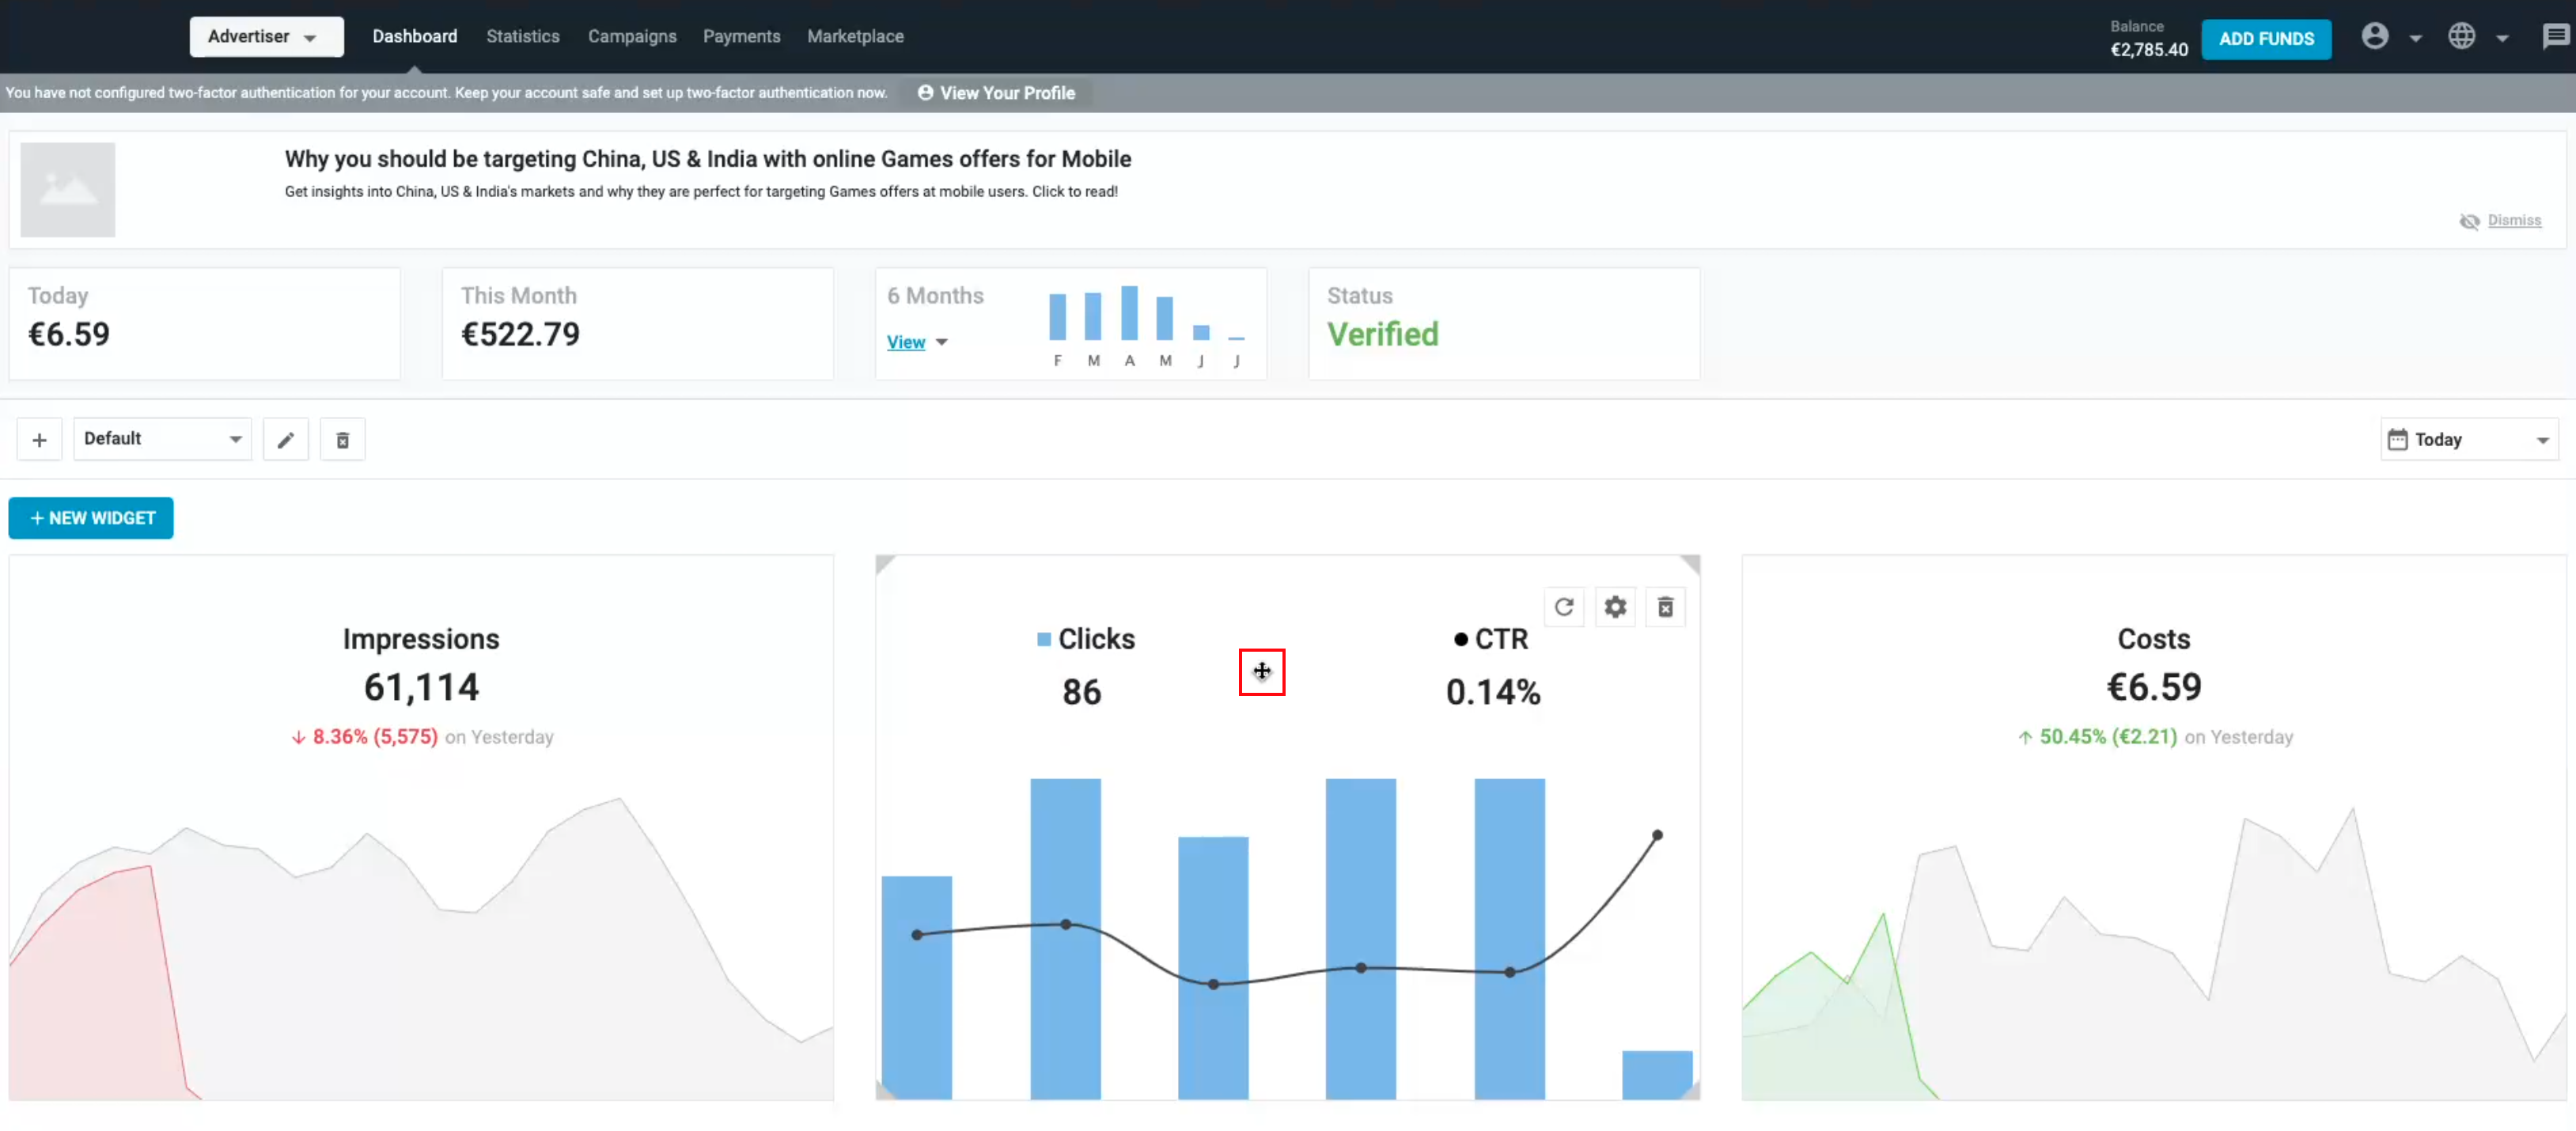
- O cursor muda para um cursor de quatro cabeças em qualquer parte do widget, onde pode ser expandido ao longo de qualquer um dos seus quatro lados.
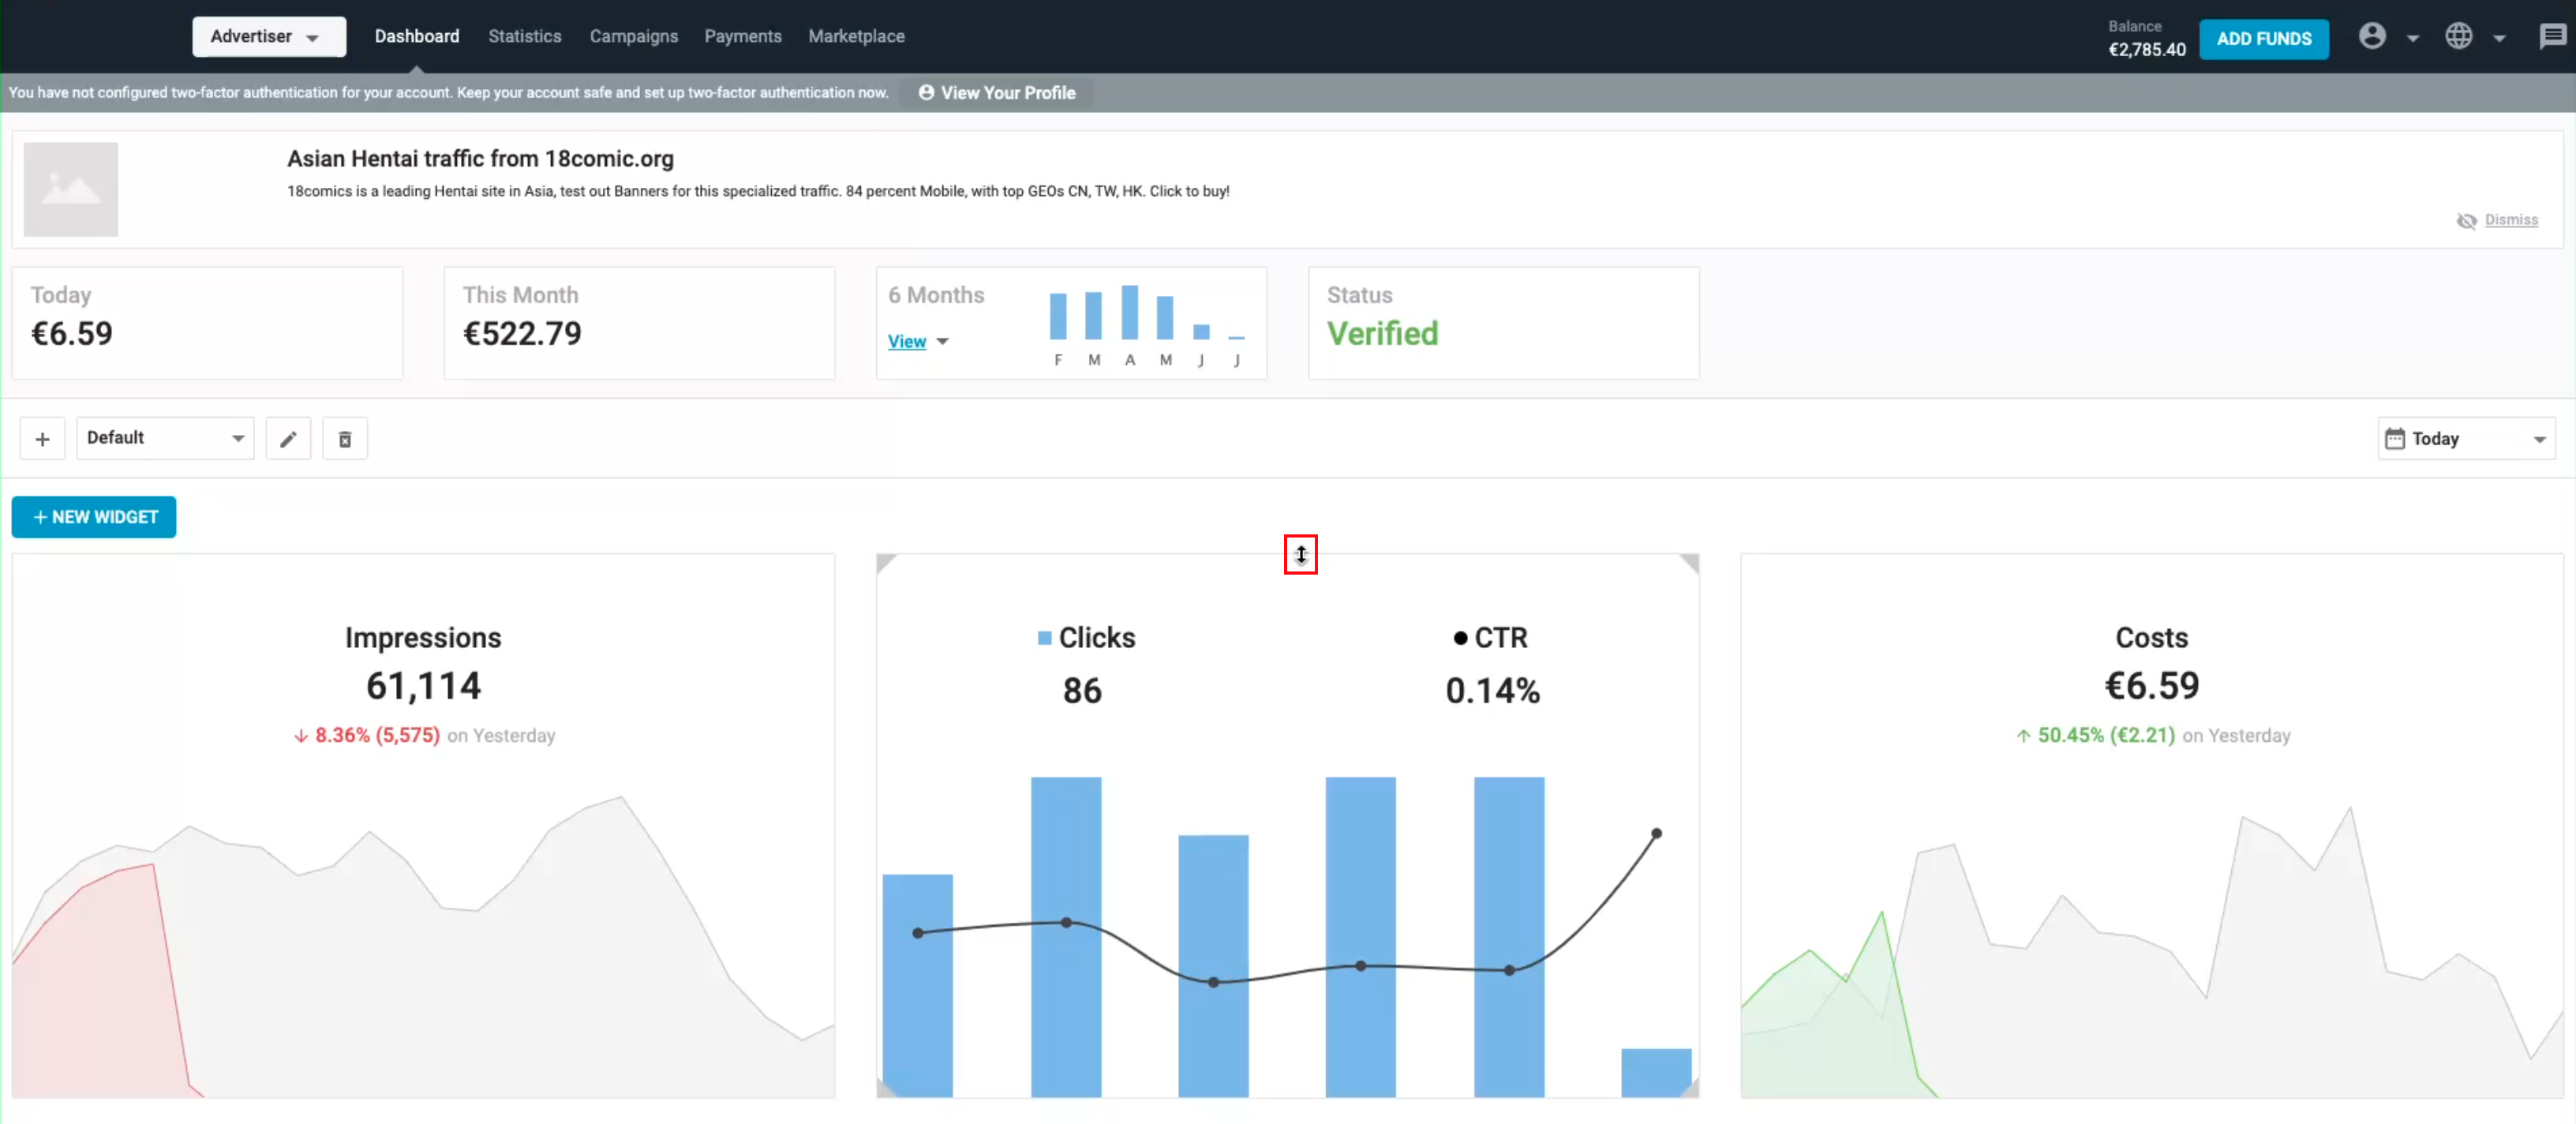
- O cursor muda para um cursor de duas cabeças quando se passa o cursor sobre as margens superior/inferior ou direita/esquerda do widget, respetivamente.
- Com o seu cursor, poderá utilizar as novas funcionalidades conforme as suas necessidades.
Widgets do painel de controlo de arrastar e largar
- Utilizando o cursor, pode alterar a posição de qualquer widget arrastando-o e largando-o de um local para outro.
- Uma grade é exibida em linhas pontilhadas no fundo enquanto você move um widget que funciona como um modelo para você saber qual lugar está disponível.
Observação:
- O número máximo de widgets num dashboard é 18.
- O tamanho máximo de um widget expandido é 2x2.
- Ao redimensionar ou arrastar e soltar um widget, os widgets vizinhos serão ajustados/movidos automaticamente para o próximo espaço disponível.