Cuadro de mandos
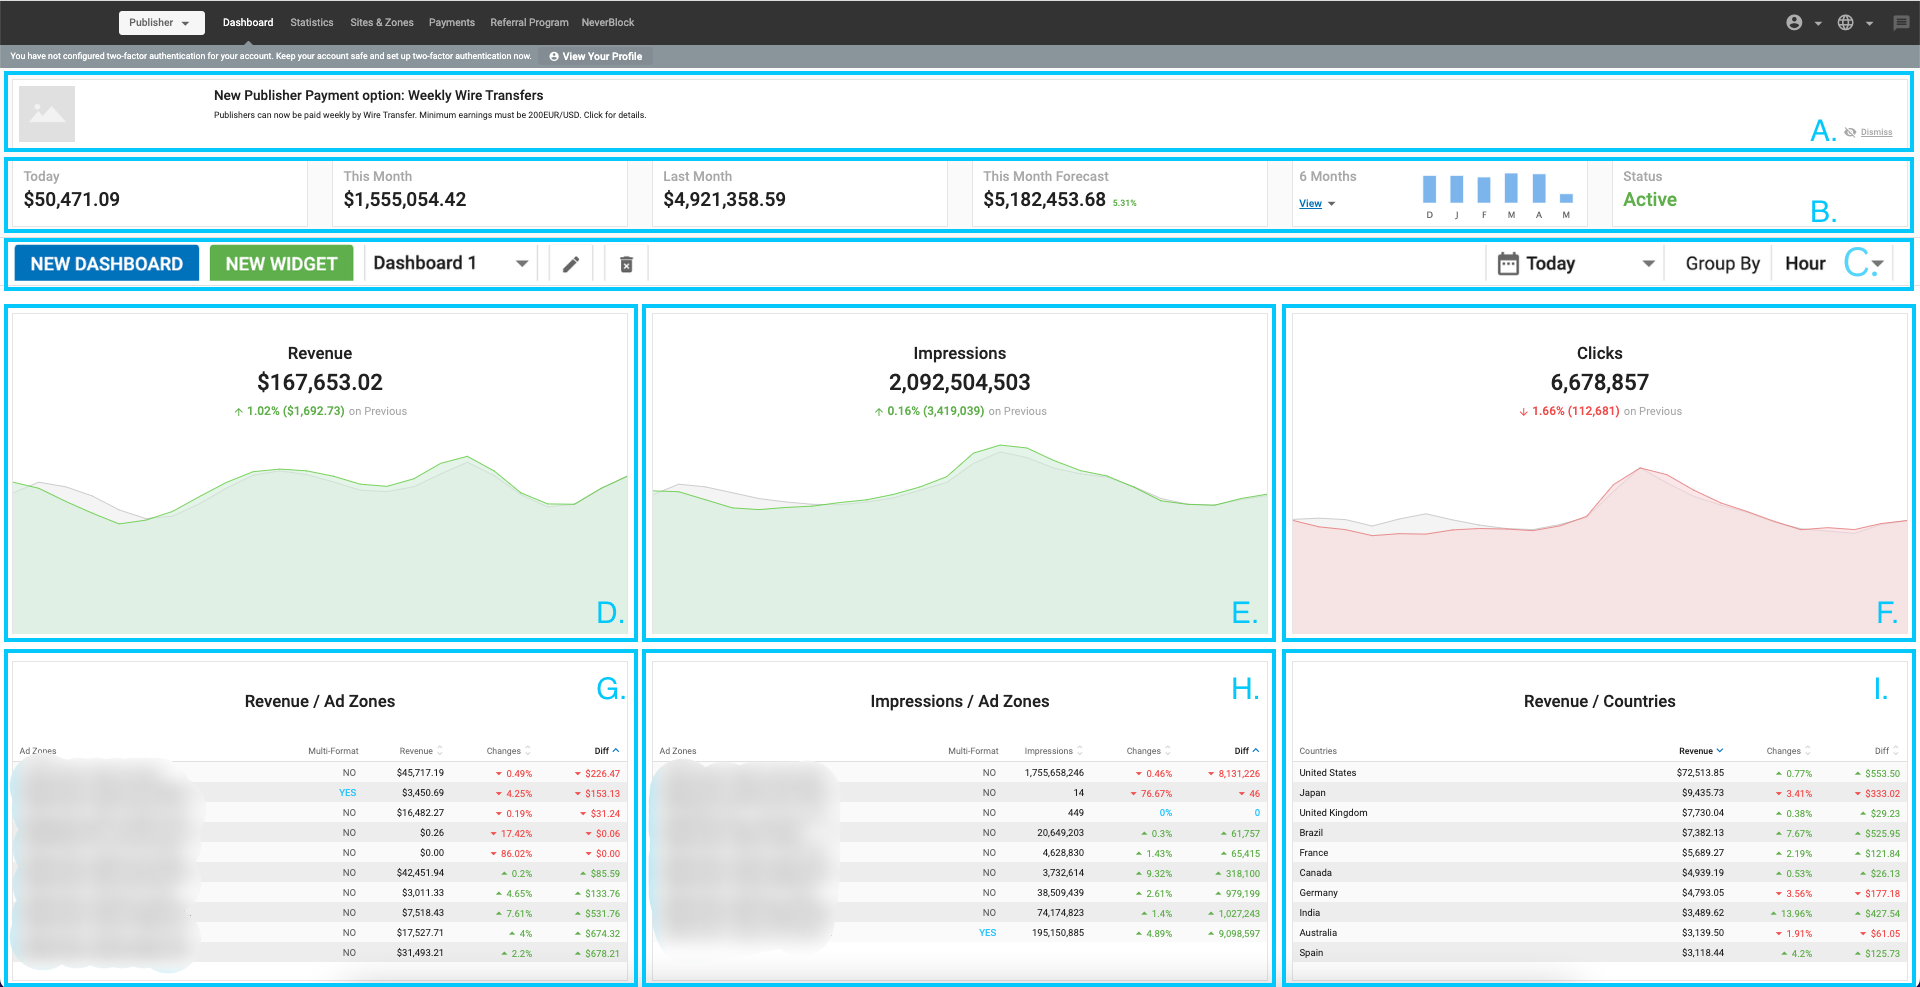
Visión general del panel de control del anunciante
Cuando inicie sesión como anunciante, el panel de control le mostrará información clave que le permitirá conocer el rendimiento de sus campañas.
Paneles superiores (A) y (B)

En la parte superior del Panel del Anunciante puede ver el Panel de noticias (A), que muestra cualquier noticia actual que pueda ser de su interés. Puede descartar u ocultar las noticias haciendo clic en el icono Descartar situado a la derecha del panel (A).
Debajo de esto en (B), puedes ver tu Saldo actual en verde, y la cantidad que has gastado en campañas para Hoy, Este Mes, y los últimos 6 Meses. Haz clic en Ver para ver el gráfico de los últimos 6 meses. El panel Estado le muestra el Estado de su cuenta, si está Verificada o No Verificada para realizar campañas publicitarias.
Nota: En las siguientes secciones verá descripciones de los gráficos y tablas por defecto que se muestran en el Cuadro de Mando. No obstante, puede personalizar el panel para que muestre los gráficos y tablas que desee.
Gráficos (C), (D), (E), Y (F)
 In (C) you can choose to add new dashboards and customize each dashboard to your needs. Also, you can choose a time option Today, Yesterday, Last 7 Days, Last 30 Days, This Month, or Last Month. You can read more about this section here in this document.

Cada uno de los tres gráficos de (D), (E) y (F) muestra dos líneas, para que puedas comparar cómo han cambiado las cosas en el periodo de tiempo que hayas seleccionado. La línea roja/verde muestra el periodo posterior, y la línea gris muestra el periodo anterior para poder comparar.
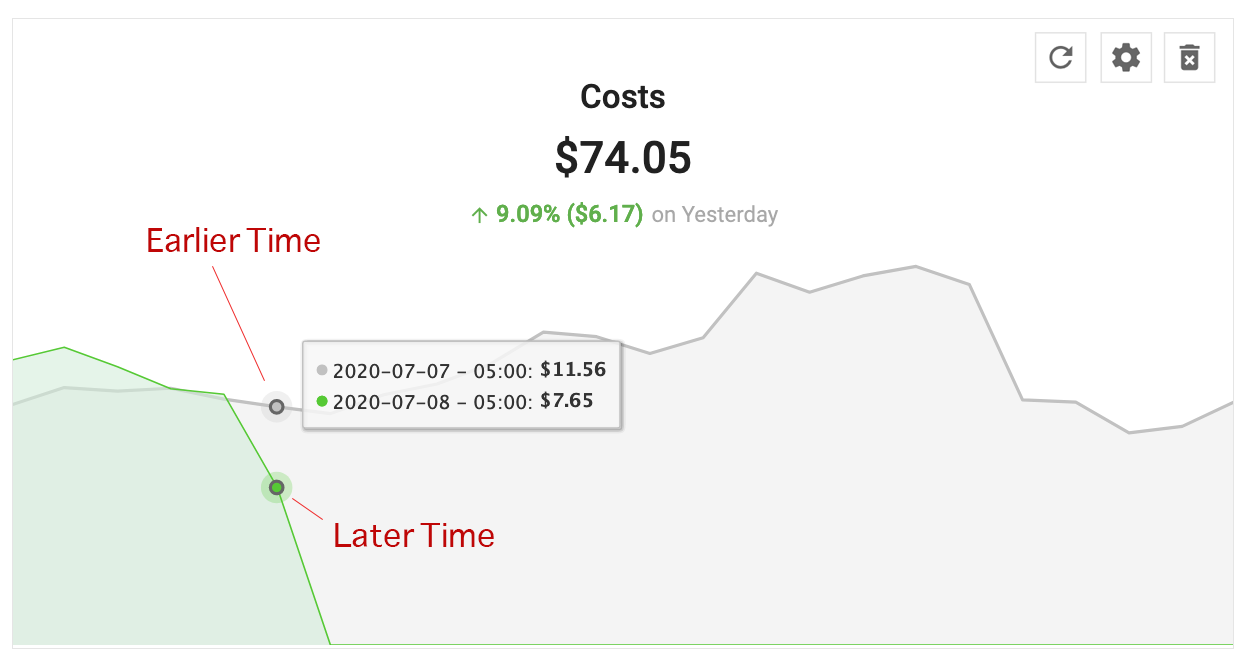
Así, si ha elegido Este mes como periodo de tiempo, cualquier punto de la línea roja le mostrará una fecha de este mes, y el gris le mostrará la fecha correspondiente del mes anterior.
Nota: Si selecciona Hoy como período de tiempo, los dos gráficos de líneas compararán los tiempos del día actual con el mismo tiempo del día anterior.
Si selecciona Ayer como período de tiempo, los dos gráficos de líneas compararán los tiempos individuales en horas de ayer con los mismos tiempos del día anterior.
D. Costes: Este gráfico muestra el total que has gastado en tus campañas en el periodo de tiempo seleccionado. El gráfico de líneas rojas/verdes muestra el total para el periodo de tiempo seleccionado, mientras que el gráfico de líneas grises muestra el periodo anterior.
E. Impresiones de vídeo: Este gráfico muestra el total de impresiones de vídeo que han recibido sus anuncios. El gráfico de líneas rojas/verdes muestra el total para el periodo de tiempo seleccionado, mientras que el gráfico de líneas grises muestra el periodo anterior.
F. Clicks: Este gráfico muestra el total de clics que han recibido sus anuncios. El gráfico de líneas rojas/verdes muestra el total para el periodo de tiempo seleccionado, mientras que el gráfico de líneas grises muestra el periodo anterior.
Cuadros (G), (H) e (I)
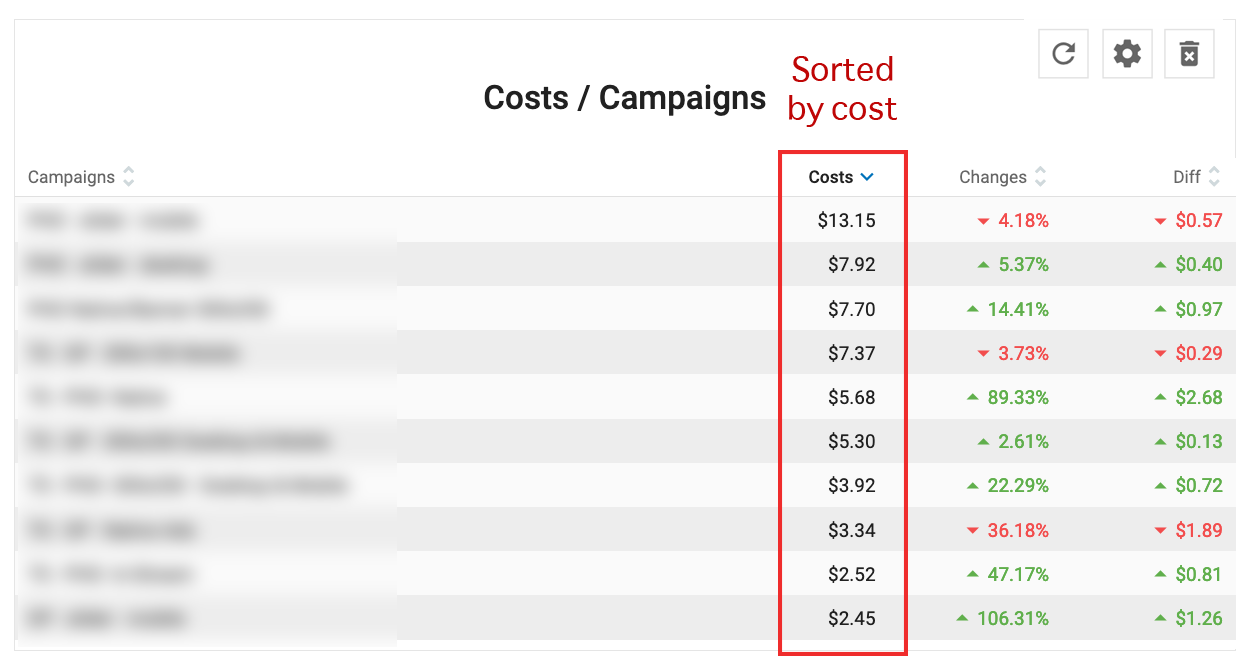
G. Gastos / Campañas: Esta tabla muestra sus gastos en diez campañas seleccionadas. La elección de las campañas viene determinada por las columnas Campaña, Coste, Cambio y Diferencia: Al hacer clic en uno de estos encabezados, la lista se ordena por valor más alto/más bajo, y las campañas que se muestran cambiarán en consecuencia.
- Coste muestra la cantidad de dinero gastada en la campaña en el periodo de tiempo seleccionado.
- Cambios muestra el cambio porcentual en el coste de la campaña en el periodo de tiempo seleccionado.
- Diff muestra la diferencia de coste de la campaña en el periodo de tiempo seleccionado.
H. Costes / Tipos de zona: Esta tabla muestra sus costes para diez tipos de zona seleccionados. La elección de los tipos de zona viene determinada por las columnas zona, coste, Cambio y Diferencia: Al hacer clic en uno de estos encabezados, la lista se ordena por valor más alto/más bajo, y el tipo de zona que se muestra cambiará en consecuencia.
- Costes muestra los costes del tipo de zona en el periodo de tiempo seleccionado.
- Cambios muestra el cambio porcentual en impresiones para la campaña en el periodo de tiempo seleccionado.
- Diff muestra la diferencia de impresiones de la campaña en el periodo de tiempo seleccionado.
I. Coste / Países: Esta tabla muestra sus gastos en diez campañas seleccionadas. La elección de las campañas viene determinada por las columnas País, Coste, Cambio y Diferencia: Al hacer clic en uno de estos encabezados, la lista se ordena por valor más alto/más bajo, y las campañas que se muestran cambian en consecuencia.
- Coste muestra la cantidad de dinero gastada en la campaña en el periodo de tiempo seleccionado.
- Cambios muestra el cambio porcentual en el coste de la campaña en el periodo de tiempo seleccionado.
- Diff muestra la diferencia de coste de la campaña en el periodo de tiempo seleccionado.
Iconos de acción en las tablas
![]()
Si pasa el ratón por encima de cualquier nombre de campaña de la tabla, aparecerán dos iconos en la parte derecha de la tabla: Editar y Estadísticas.
- Al hacer clic en el icono Editar accederá al Paso 1: Detalles generales de esa campaña, para que pueda editarla.
- Haciendo clic en el icono Estadísticas accederá a la pestaña Estadísticas, filtradas para esa campaña.
Personalizar el panel de control
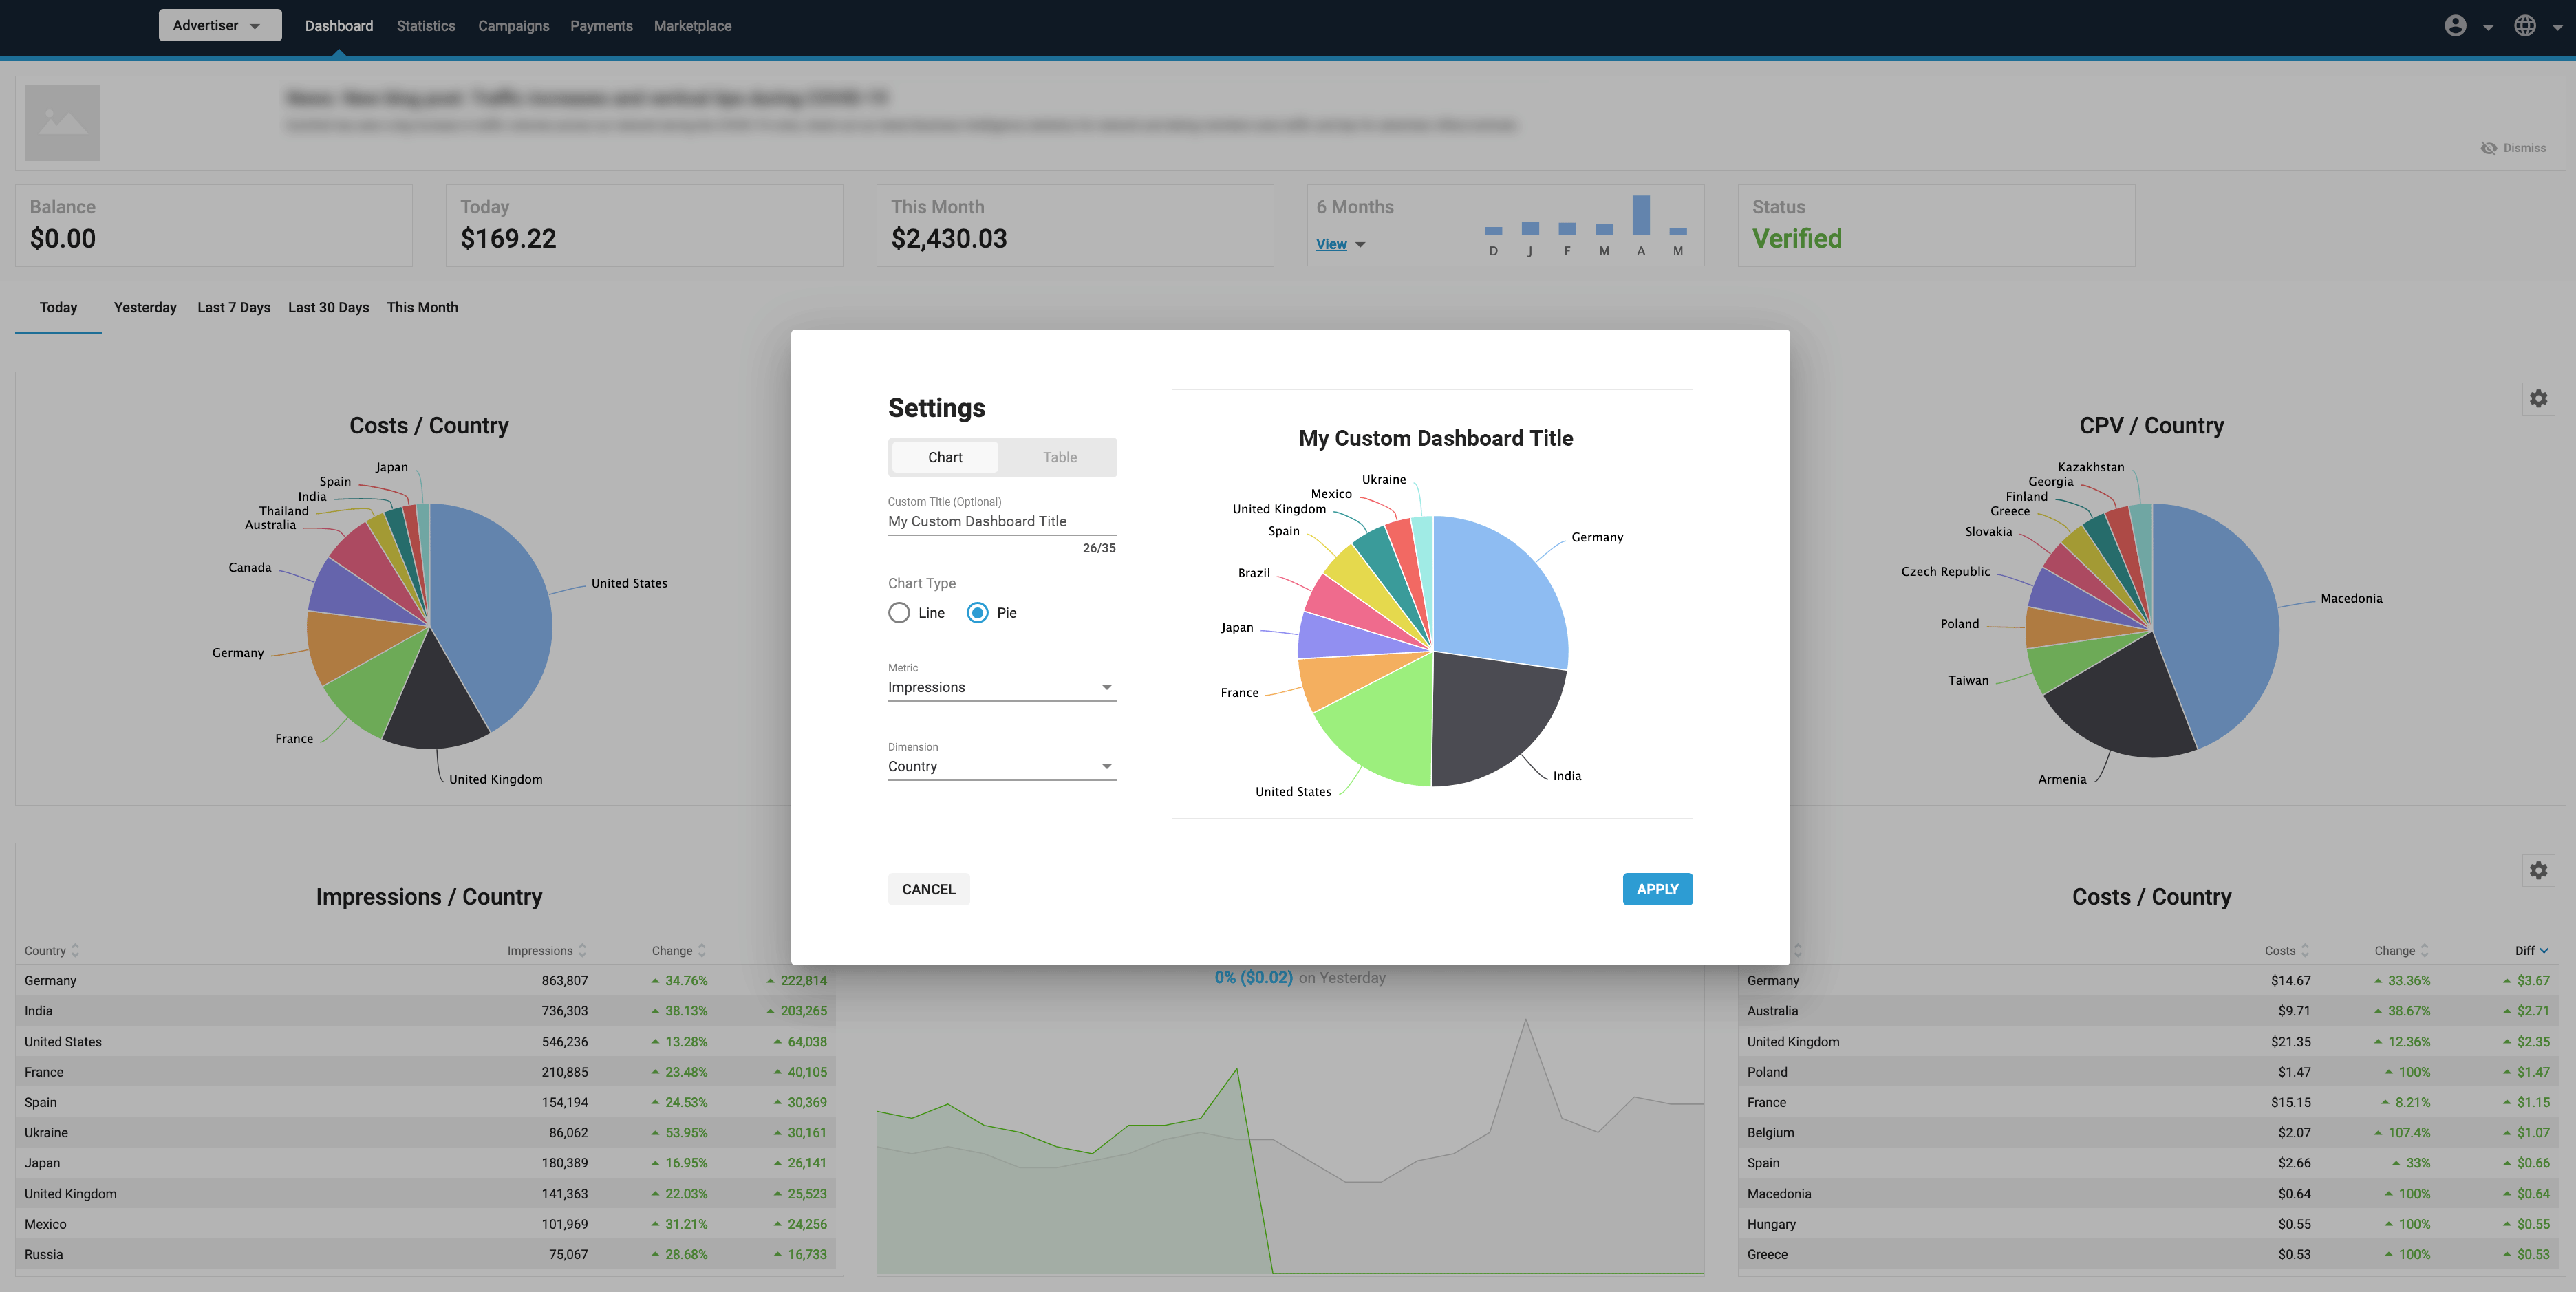
También es posible personalizar los datos que se muestran en su Dashboard. Puede elegir entre una selección de métricas y dimensiones para mostrar en las 9 ranuras de su Dashboard. Esto puede ayudarle a centrar su panel en los datos concretos más relevantes para su negocio.
En la parte superior derecha de cada una de las 9 ranuras, haga clic en el icono de configuración para personalizar los datos mostrados en cualquiera de los paneles. Aparecerá la ventana emergente Configuración del panel. Aquí puede establecer qué métricas desea ver en la ficha:
Establezca si desea ver un Gráfico o una Tabla utilizando las pestañas.
Añadir un título personalizado
El anunciante puede guardar un título personalizado para cada widget grande del panel de control. Este campo Título personalizado es opcional. Puede añadir el título personalizado que mejor se adapte a la configuración del widget.
Crear un gráfico
Si elige Gráfico, puede seleccionar si desea mostrar un Gráfico combinado, un Gráfico de líneas o un Gráfico de tartas:
- Combo: Seleccione una Métrica para mostrar en un gráfico de barras, con una Métrica secundaria para mostrar en un gráfico de líneas.
- Línea: Seleccione una Métrica para mostrar en el gráfico de líneas. Esto mostrará dos líneas, una para el periodo de tiempo seleccionado, por ejemplo, días, y una línea roja/verde para el periodo de tiempo anterior correspondiente.
- Pastel: Selecciona una Métrica para comparar con una Dimensión en los desplegables.
Después de seleccionar el tipo de gráfico, la métrica y la dimensión, haga clic en Vista previa de actualización para ver el resultado a la derecha del cuadro Configuración del cuadro de mando.
Haga clic en Aplicar para mostrar este gráfico en su panel de control.
Creación de una tabla
Si elige Tabla, seleccione una Métrica para comparar con una Dimensión de la tabla.
Verá una vista previa de su tabla en la parte derecha del cuadro Configuración del Cuadro de Mando.
Haga clic en Aplicar para mostrar esta tabla en su Panel de control.
Añadir y eliminar widgets en el panel de control
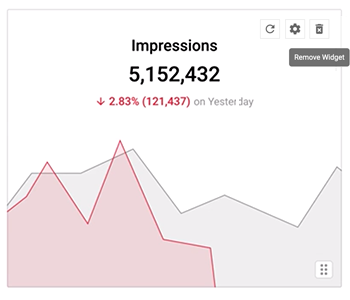
Puede eliminar cualquiera de los seis gráficos/tablas de su panel de control haciendo clic en el icono de eliminación situado en la parte superior derecha de cualquiera de ellos.
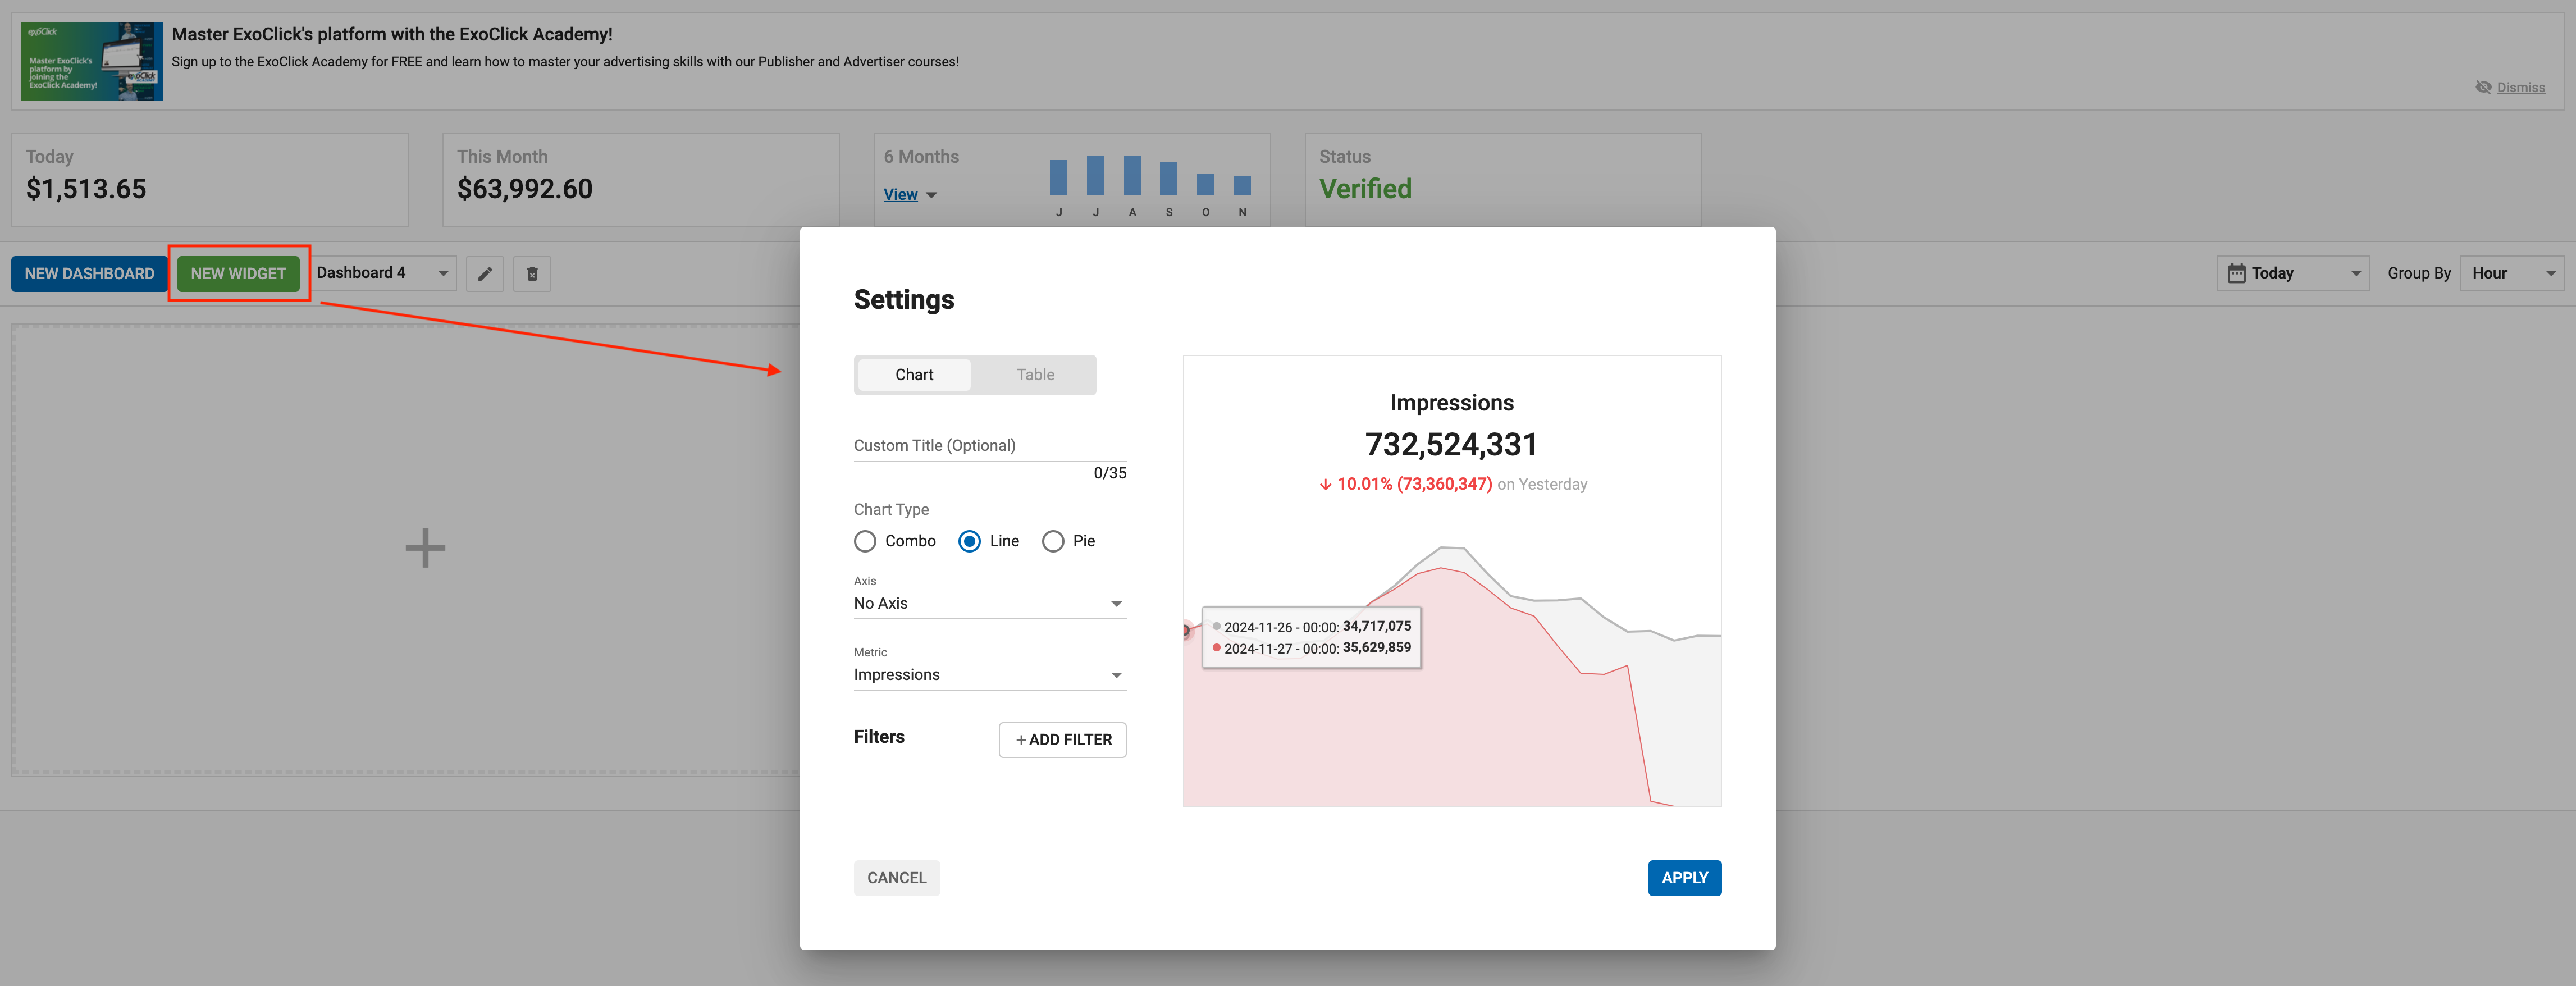
Una vez eliminado un widget, puede añadir uno completamente nuevo pulsando el botón Nuevo widget. A continuación, puede configurar el gráfico/tabla según sus necesidades.

Filtrar tablas o gráficos
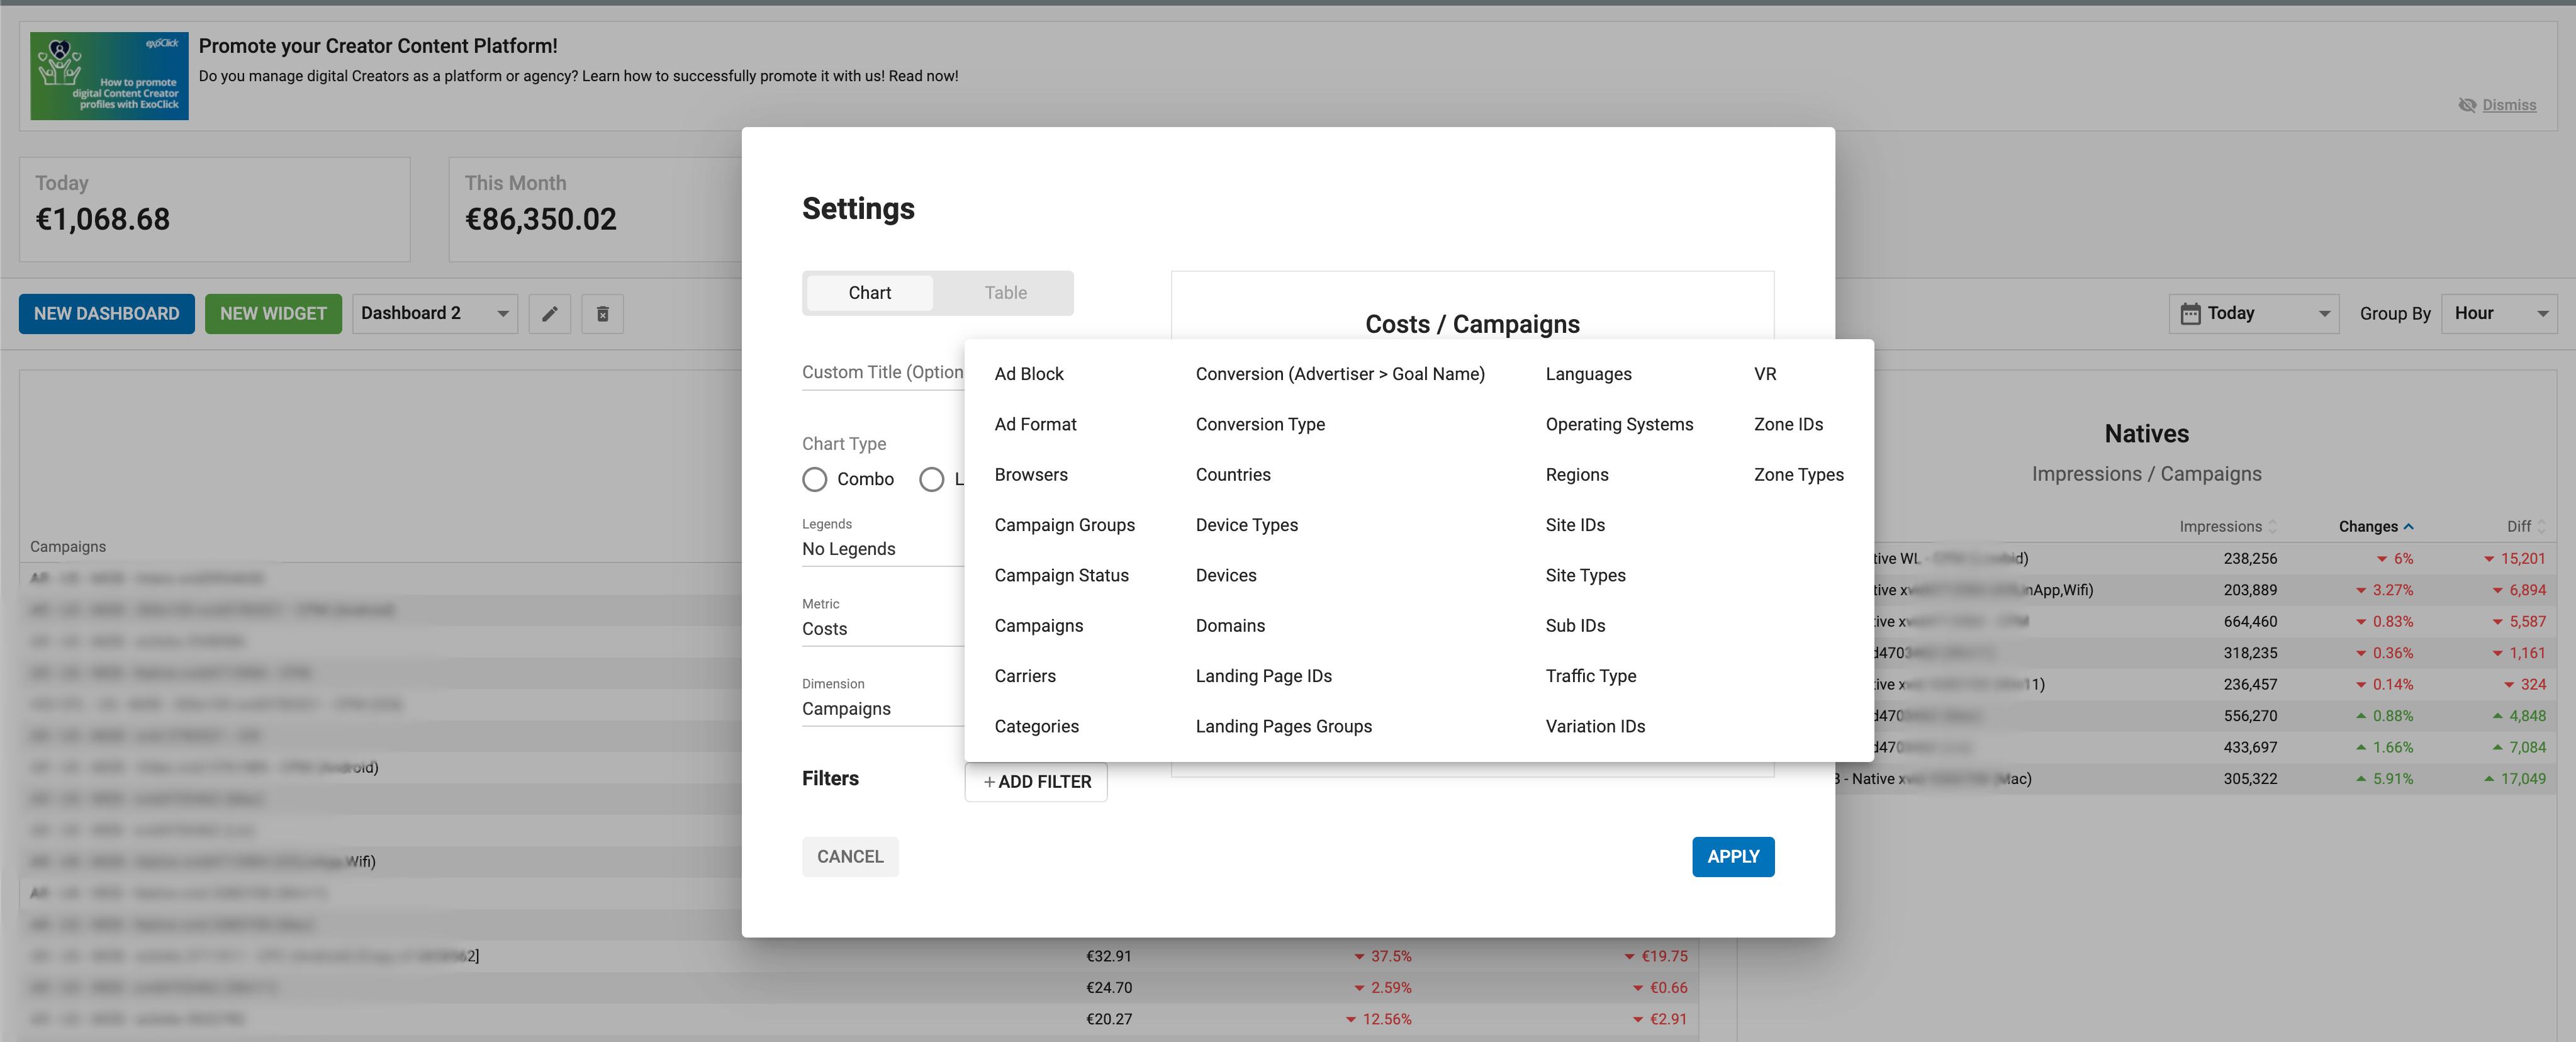
También puede añadir un filtro a cualquier gráfico o tabla que cree en su panel de control. Por ejemplo, puede crear un gráfico de líneas que muestre los gastos de hoy y filtrarlo por navegadores.
Para ello, haga clic en el botón +Añadir filtro situado en la parte inferior del panel Configuración del panel y seleccione un filtro de la lista:
- Cuando elija un filtro, podrá elegir los elementos por los que desea filtrar: Por ejemplo, si elige filtrar por navegadores, puede utilizar las casillas de verificación para elegir los navegadores por los que desea filtrar.
- Utilice la casilla Mostrar sólo seleccionados para excluir los elementos que no ha seleccionado, y elija Seleccionar todo para seleccionar todos los elementos.
- Puede añadir varios filtros pulsando de nuevo el botón Añadir filtro.
Una vez que haya añadido los filtros que necesite, haga clic en el botón Previsualizar actualización del gráfico o la tabla para ver cómo queda.
Una vez que se ha aplicado un filtro a un widget, verás el símbolo Filtro aplicado a su izquierda:
Filtros disponibles para anunciantes
- Bloqueo de anuncios
- Formato del anuncio
- Navegadores
- Grupos de campaña
- Estado de la campaña
- Campañas
- Transportistas
- Categorías
- Tipo de conversión
- Conversión (Anunciante > Nombre del objetivo)
- Países
- Tipos de dispositivos
- Dispositivos
- Dominios
- ID de página de destino
- Grupos de páginas de destino
- Idiomas
- Sistemas operativos
- Regiones
- Identificación de sitios
- Subidentificación
- Identificación de variaciones
- VR
- ID de zona
- Tipos de zonas
Añadir nuevos cuadros de mando
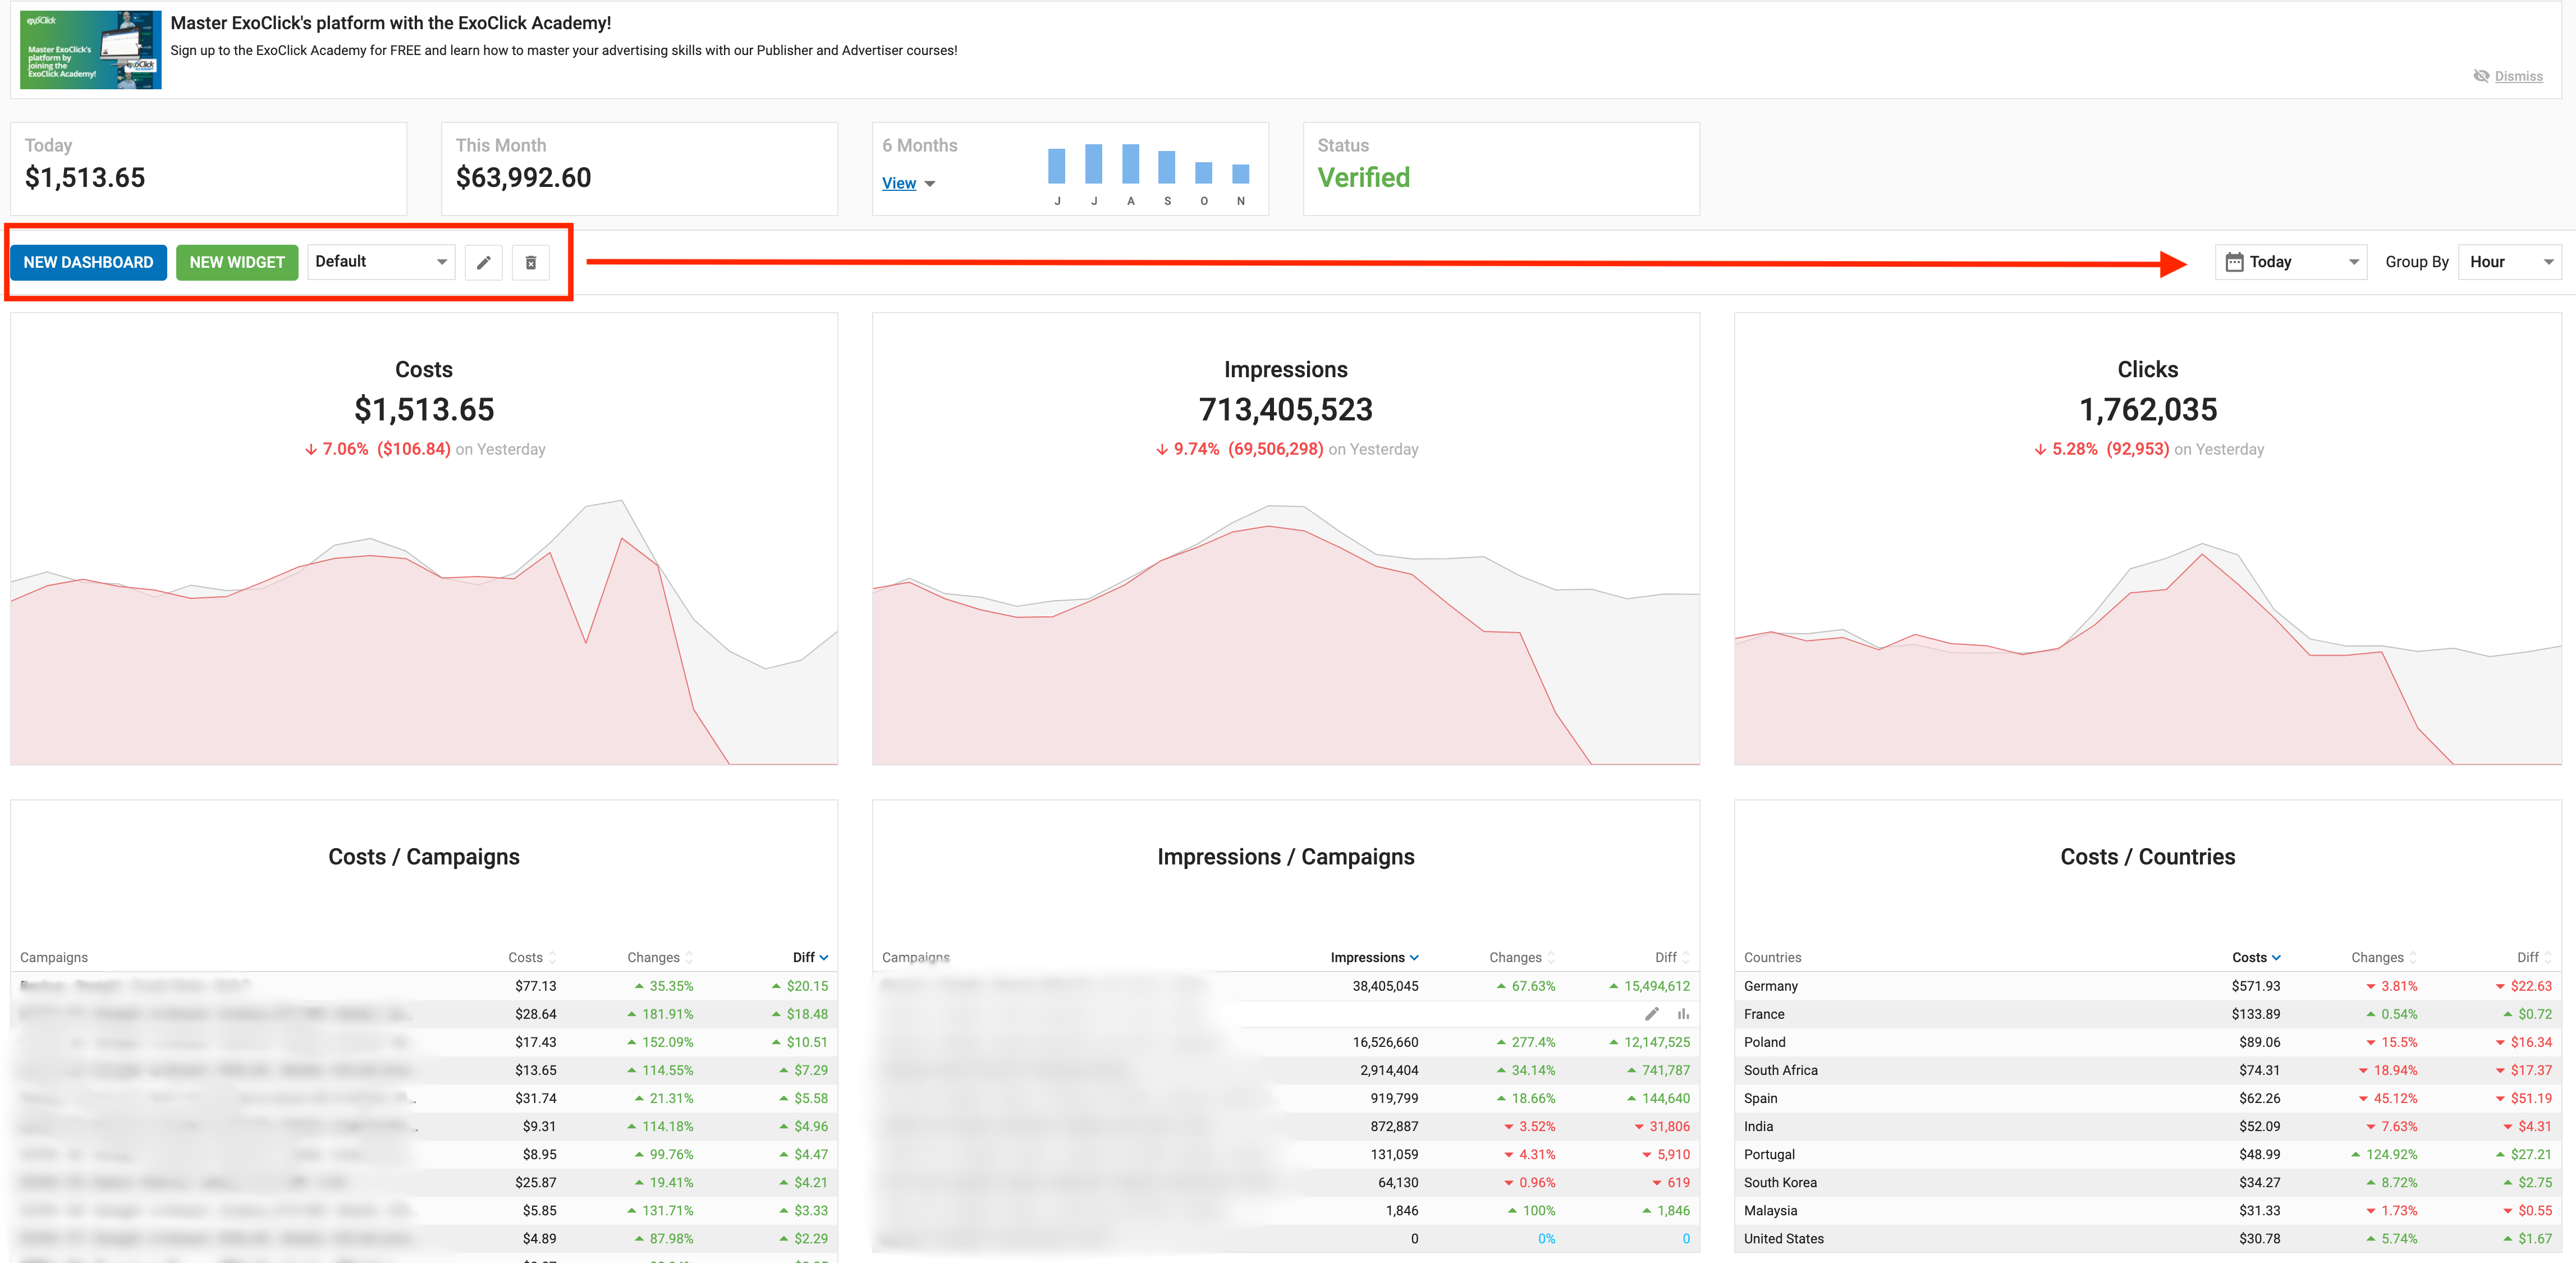
Como Anunciante, puedes crear múltiples Tableros personalizados. De esta forma, puedes configurar cada uno de tus Dashboards con los datos específicos que sean más relevantes para tu negocio. Esto te permitirá organizar múltiples Cuadros de Mando y ver de un vistazo la información que necesitas conocer.
Añadir nuevo cuadro de mando

- Haga clic en el botón Nuevo Cuadro de Mando para añadir un nuevo Cuadro de Mando.
- Haga clic en el botón Nuevo widget para añadir un widget y, a continuación, actualícelo con una tabla o gráfico y la métrica que se adapte a sus necesidades.
Cambiar el nombre de un panel
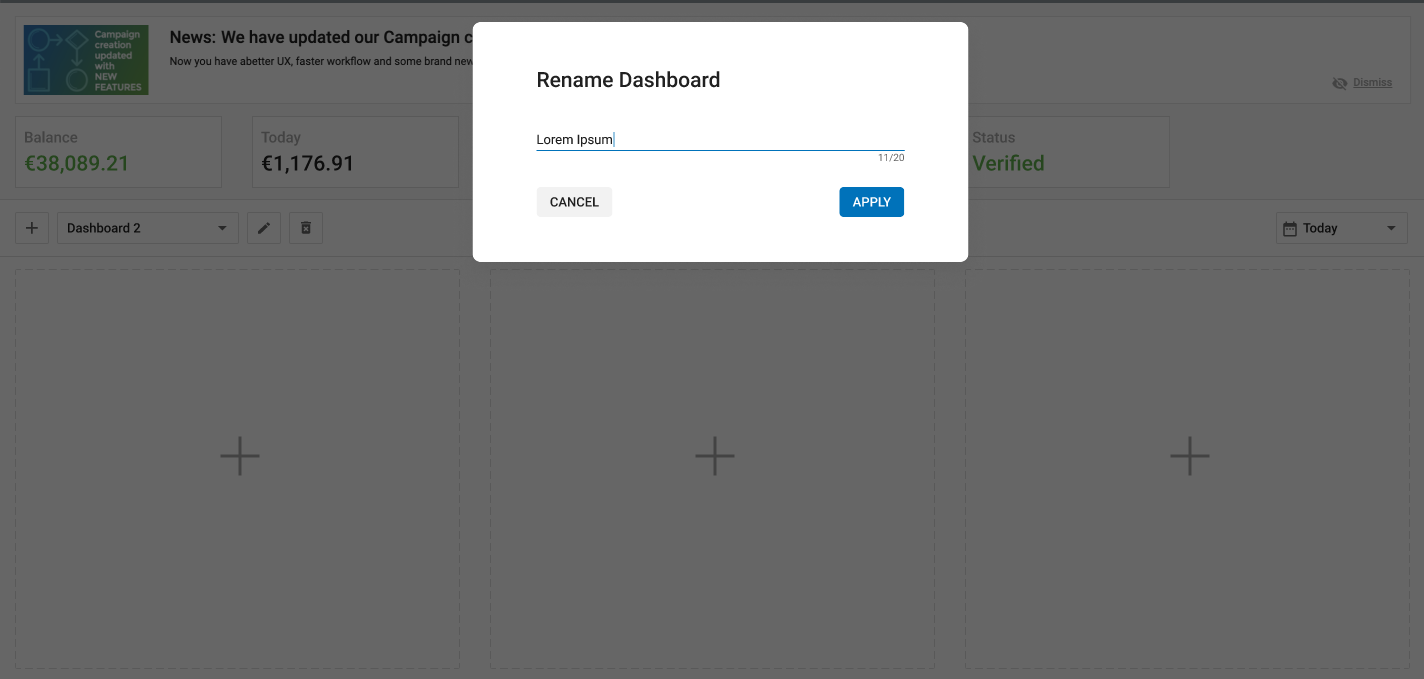
- Haga clic en el icono Lápiz para cambiar el nombre de un panel de control.
- Puede elegir el nombre que mejor defina la información que desea mostrar en ese Panel.
- Pulse el botón APPLY para que se guarde este nombre.
Borrar un cuadro de mando
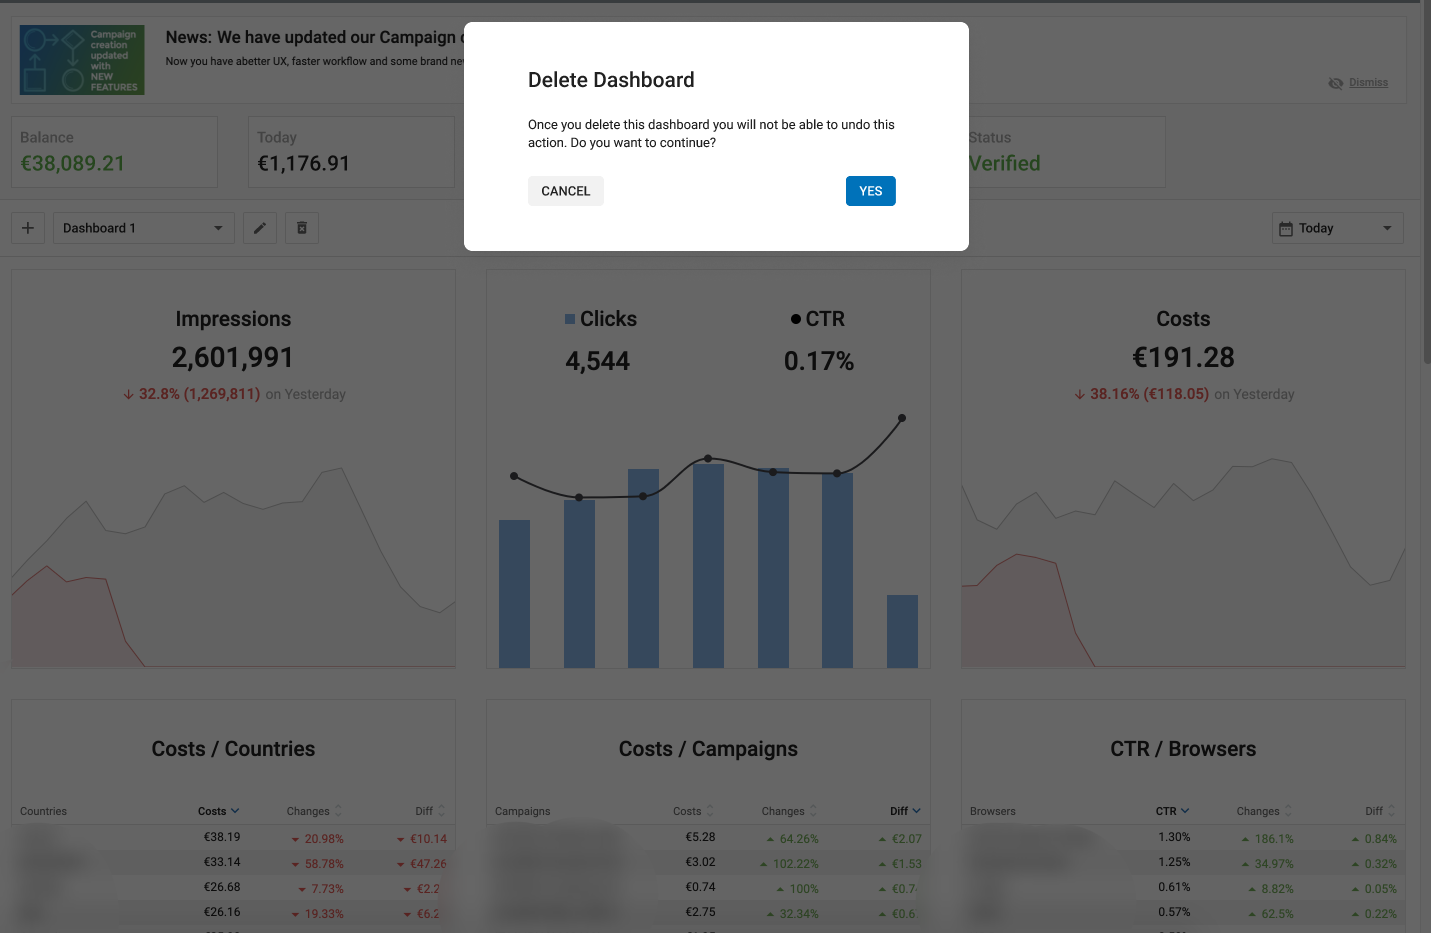
- Haga clic en el icono Bin para eliminar un Cuadro de mandos.
- Una vez que elimine un Panel de control, no podrá deshacer esta acción.
- Un Anunciante puede eliminar todos los cuadros de mando si es necesario.
Arrastre, suelte y amplíe los widgets del panel de control
Como Anunciante, podrás arrastrar, soltar o expandir cualquier widget dentro del Cuadro de Mando. Esto le permitirá cambiar fácilmente la posición de los widgets y/o expandirlos, de forma que sus cuadros de mando destaquen los datos relevantes de la mejor manera posible.
Ampliar los widgets del panel de control
- Las cuatro esquinas se resaltan con iconos de expansión.
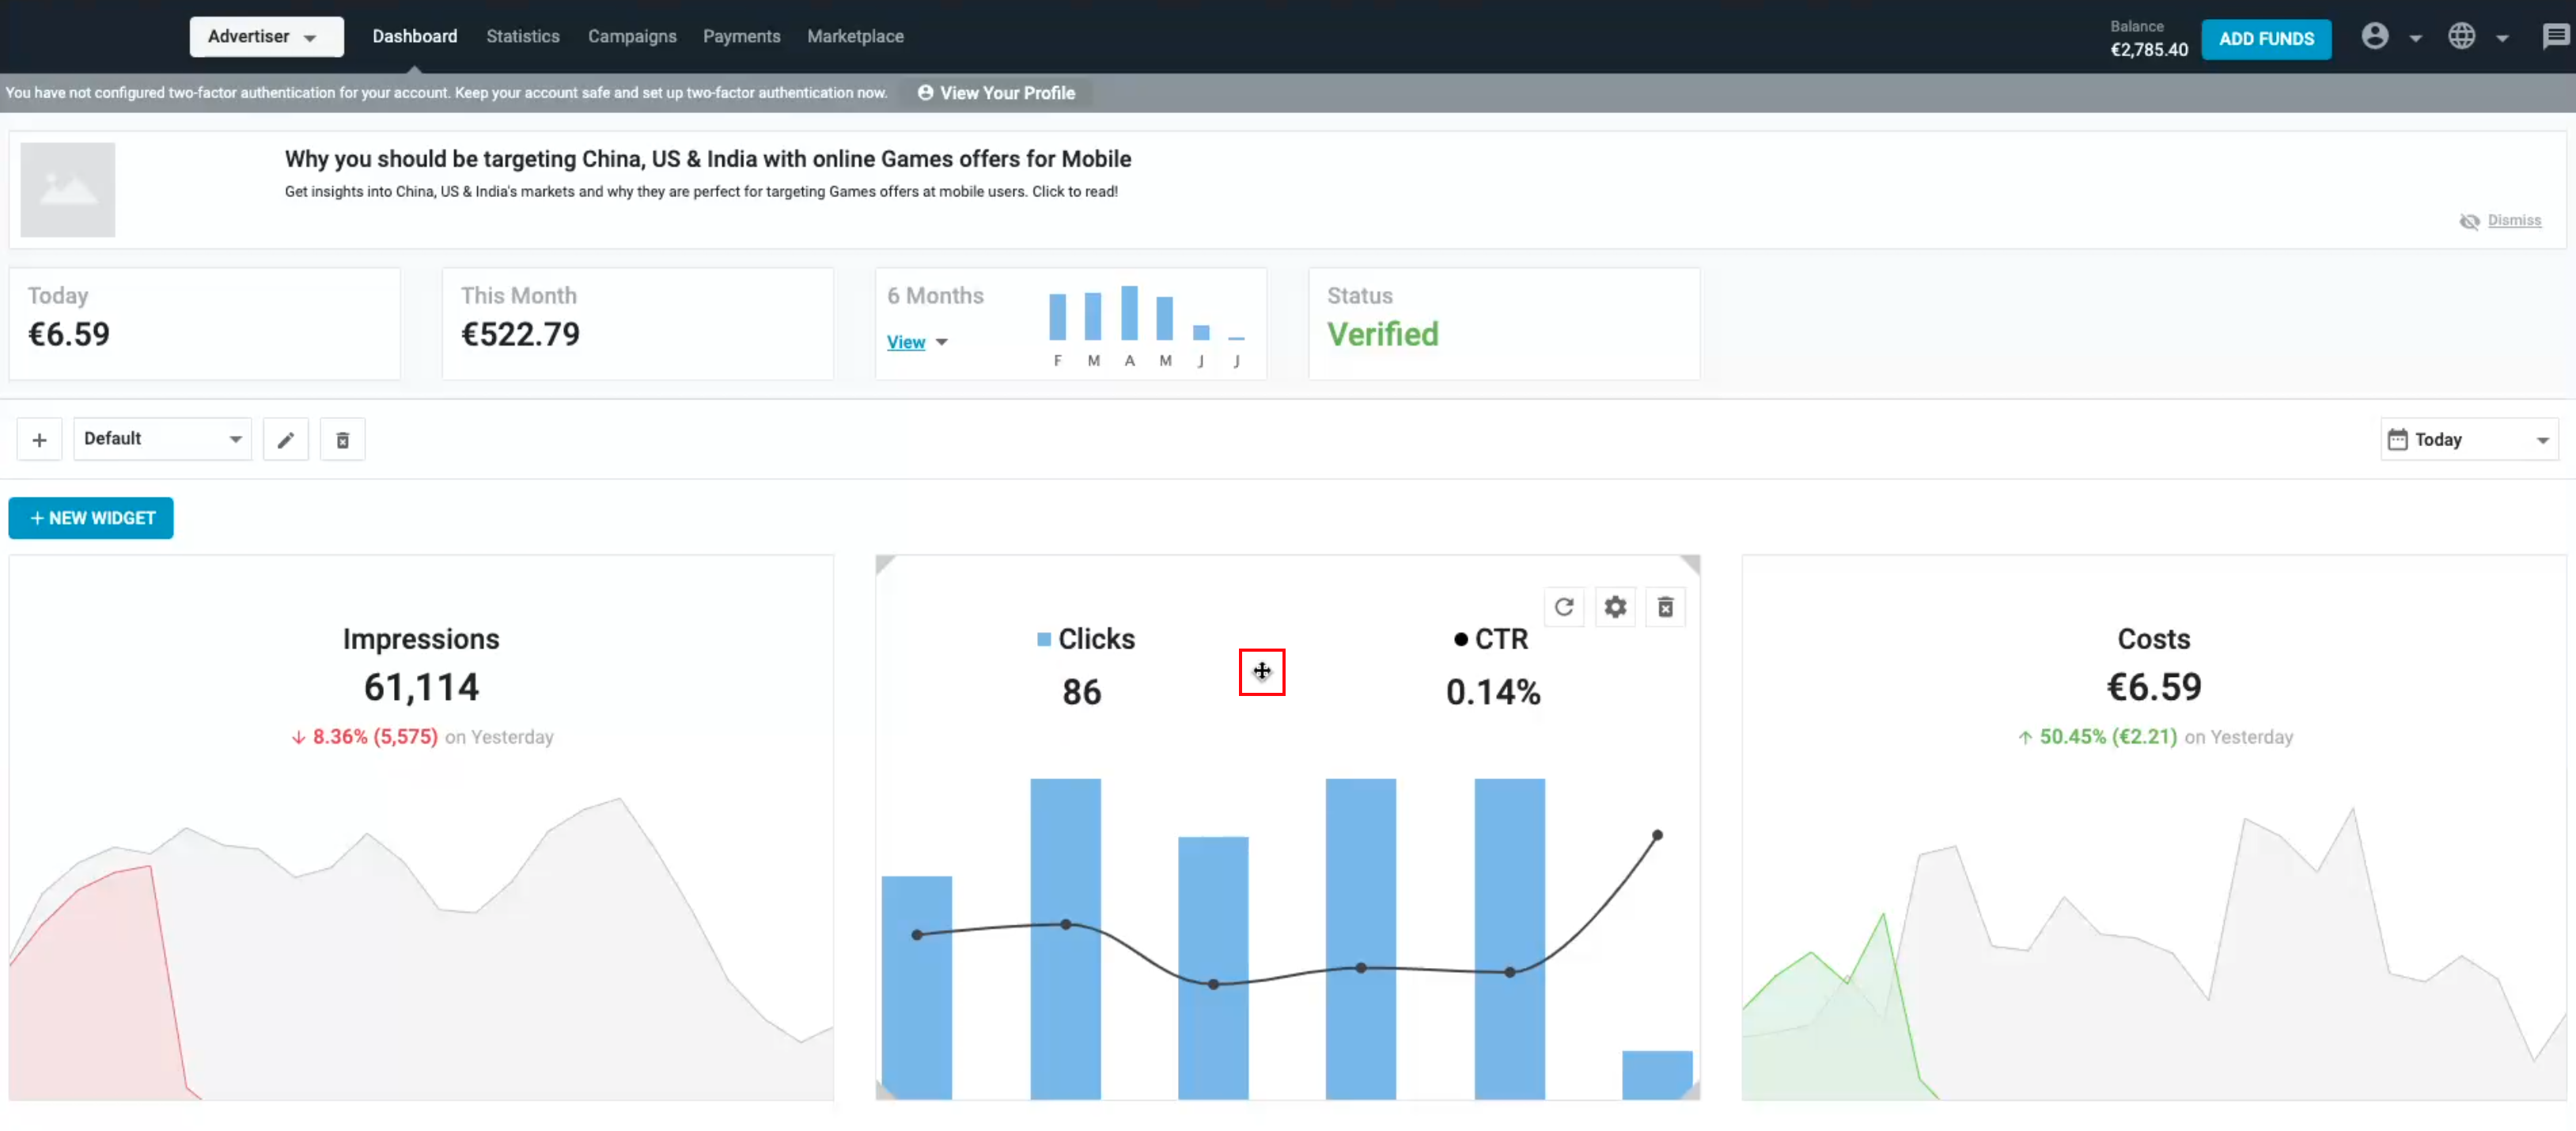
- El cursor cambia a un cursor de cuatro cabezas en cualquier parte del widget donde puede expandirse a lo largo de cualquiera de sus cuatro lados.
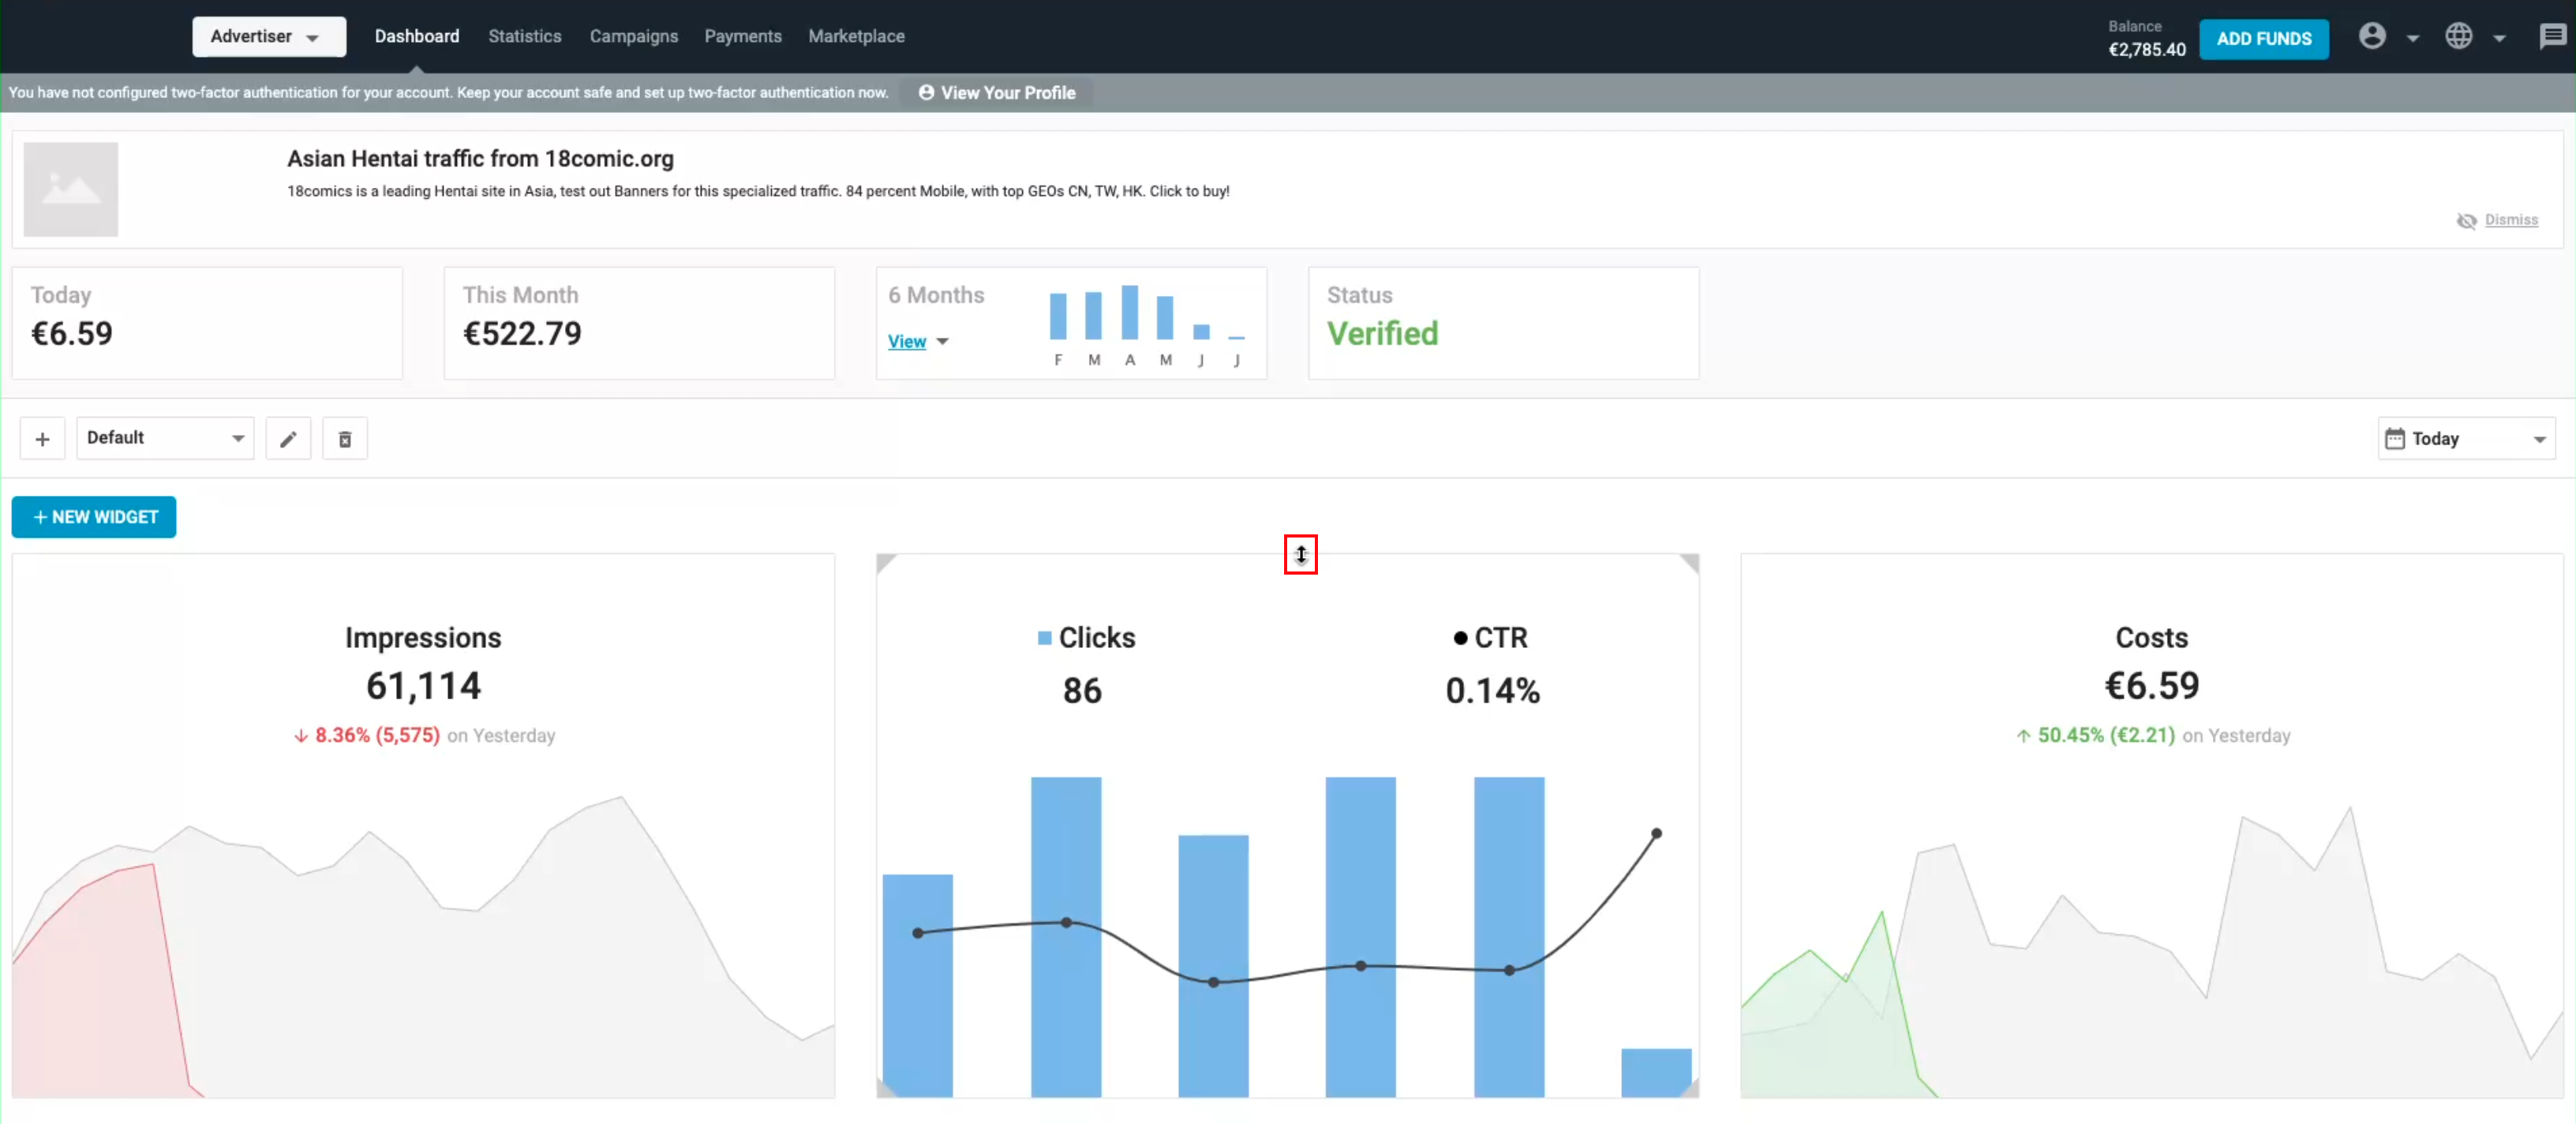
- El cursor cambia a un cursor de dos puntas cuando se sitúa sobre los bordes superior/inferior o derecho/izquierdo del widget respectivamente.
- Con el cursor podrás utilizar las nuevas funciones según tus necesidades.
Widgets del panel de control de arrastrar y soltar
- Con el cursor, puedes cambiar la posición de cualquier widget arrastrándolo y soltándolo de un lugar a otro.
- Se muestra una cuadrícula de líneas punteadas en el fondo mientras se mueve un widget que actúa como plantilla para que usted sepa qué lugar está disponible.
Nota:
- El número máximo de widgets en cualquier panel de control es 18.
- El tamaño máximo de un widget expandido es 2x2.
- Al cambiar el tamaño o arrastrar y soltar un widget, los widgets vecinos se ajustarán/moverse automáticamente al siguiente espacio disponible.